Figures & data
Figure 1. Illustration of the influence of functional imaging on RT planning. Panel a) shows a coplanar plan where functional information was not used. In panel b) functioning lung was preferentially avoided when selecting coplanar beam directions. From Christian et al. [Citation24].
![Figure 1. Illustration of the influence of functional imaging on RT planning. Panel a) shows a coplanar plan where functional information was not used. In panel b) functioning lung was preferentially avoided when selecting coplanar beam directions. From Christian et al. [Citation24].](/cms/asset/9f8a054d-ae44-4f61-b67a-d160b391c757/ionc_a_504735_f0001_b.jpg)
Figure 2. Schematic diagram for creating a 4D-CT ventilation image through deformable image registration and quantitative analysis of the resultant displacement vector field for computing the ventilation metric.
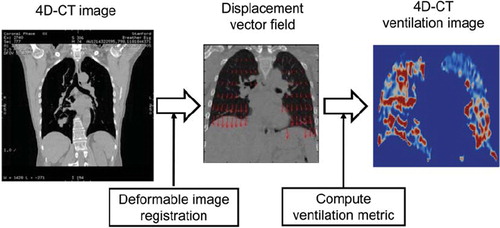
Figure 3. Example coronal images at the same level of peak-exhale CT and 4D-CT ventilation derived from the different combinations of two deformable image registration algorithms: surface-based registration and non-parametric volume-based registration, and two ventilation metrics: Hounsfield unit (HU)-change and Jacobian determinant of deformation.
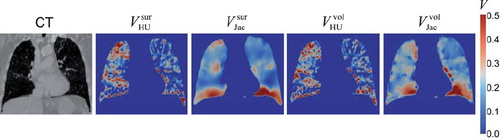
Figure 4. Example isodose distributions of anatomical and functional VMAT plans. Functional VMAT spared the highly-functional lung, and anatomical VMAT treated the lungs as uniformly functional. Highly-functional lung regions are shaded orange; PTV red; spinal cord planning organ-at-risk volume (PRV) green; oesophagus PRV brown and heart pink.
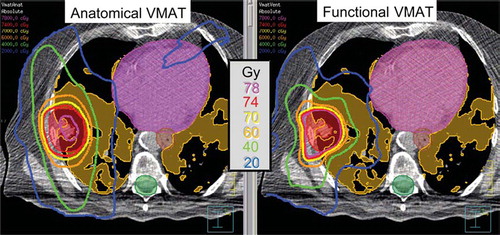
Figure 5. Transaxial co-registered image of the CT dose-plan and functional PET through the parotid glands. The CT dose-plan shows the radiation isodose curves (right-hand colour scale). The functional PET image gives voxel values of the net metabolic clearance of 11C-methionine (left-hand colour scale). From Buus et al. [Citation76].
![Figure 5. Transaxial co-registered image of the CT dose-plan and functional PET through the parotid glands. The CT dose-plan shows the radiation isodose curves (right-hand colour scale). The functional PET image gives voxel values of the net metabolic clearance of 11C-methionine (left-hand colour scale). From Buus et al. [Citation76].](/cms/asset/13ea905b-3846-491e-b99a-8a9aac725997/ionc_a_504735_f0005_b.jpg)