Figures & data
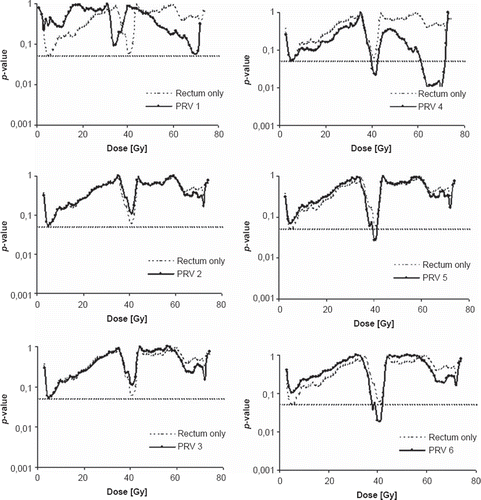
Table I. The different combinations of rectum margins [mm] applied: PRV 1–3 expanded in anterior direction only and PRV 4–6 in both anterior and posterior direction.
Figure 1. The p-values from the logistic regression (permutation tests confirmed these p-values) between the maximum recorded rectum late morbidity and the relative volumes receiving a certain dose for rectum only (thin broken line) and with the six different margins (solid black lines) added. Dotted horizontal line indicates significance (p ≤ 0.05).

Table II. The calculated average area under the DVH curve (AUC) for the PRVs with intervals of significant dose levels for the high- and the intermediate dose levels. For the maximum RTOG morbidity end-point the AUC is calculated for PRV 4 (high dose levels) and PRV 4, 5 and 6 (intermediate dose levels). The AUC from the maximum RTOG morbidity end-point together with the prolonged GI Grade 1 is instead determined for PRV 1, 3 and 6 (high dose levels) and for the rectum only and all PRVs (intermediate dose levels).
Table III. The generalized equivalent uniform dose (gEUD) with corresponding SD (in brackets) as well as the p-value for the difference in gEUDs between patients with or without the late maximum GI RTOG Grade 2 or higher rectal morbidity for the rectum only and rectum with margins with different values of the n parameter (0.08, 0.12 and 0.23).
Figure 2. The p-values from the logistic regression (permutation tests confirmed these p-values) between the maximum late GI Grade 2 or higher toxicity group including also patients with prolonged GI Grade 1 and the relative volumes receiving a certain dose for rectum only (thin broken line) and with wide margins (solid black lines) added in anterior direction only (PRV 3) or in both anterior and posterior direction (PRV 6) added. Dotted horizontal line indicates significance (p ≤ 0.05).


