Figures & data
Table I. Patient characteristics.
Figure 1. Kaplan-Meier actuarial estimate of late rectal bleeding > = grade 2. Ninety percent of cases are observed within two years of the end of radiotherapy.
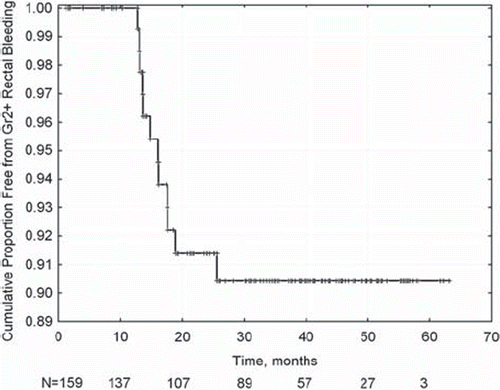
Figure 2. Freedom from > = grade 2 rectal bleeding in patients aged over (or under) 77 years when commencing RT (p=0.007; log-rank test).
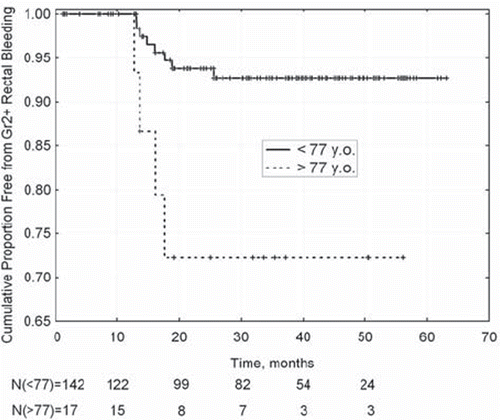
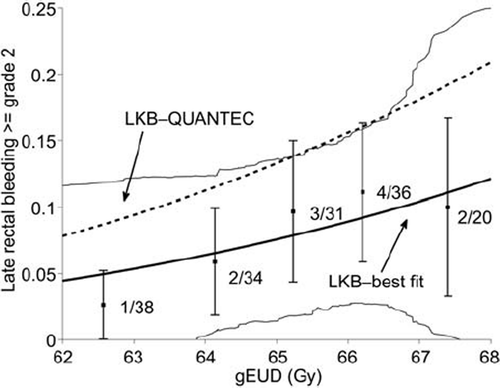
Figure 3. Incidence of late rectal bleeding as a function of gEUD. Data was binned in 1 Gy intervals according to computed gEUD values with the best fit n parameter value of 0.068. Error bars are binomial 68% confidence intervals. Only three plans fell outside the gEUD range 62 to 68, and were not included. The estimated 95% confidence interval for the best-fit model is shown by thin solid lines. The QUANTEC-recommended LKB model is shown as the dashed line (ignoring a small error due to the slightly different n values). Observed rates are smaller than QUANTEC predicted rates at all gEUD levels.