Figures & data
Figure 1. Display of a maximum intensity projection (MIP) in coronal view (A), as well as a transverse PET slice reconstructed by CT attenuation correction. A solitary, FDG avid mass is recognized in projection onto the left lung. Corresponding pathology represents a NSCLC. Tumor stage by imaging and biopsy sampling of mediastinal nodes was T1N0M0.
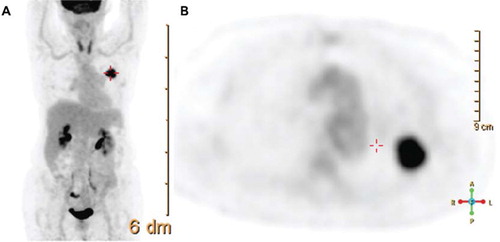
Figure 2. Different approaches to assessing the glucose metabolic activity of a lung lesion (biopsy confirmed NSCLC). Assessment by SUVmax (A) by fitting a sphere of 23.5 mm diameter to the lesion detects maximum uptake of 9.5. Mean uptake in a 10 mm diameter circular area around the location of SUVmax reveals a peakSUV of 7.4 (B). Automated threshold rendering (C) based on a minimum SUV of 3 allows der iving SUVmax, SUVmean, and a volume with an uptake higher than selected threshold (here 8.1 cm3). This threshold rendered structure may be exported to a radiation therapy planning software for objective structure generation.
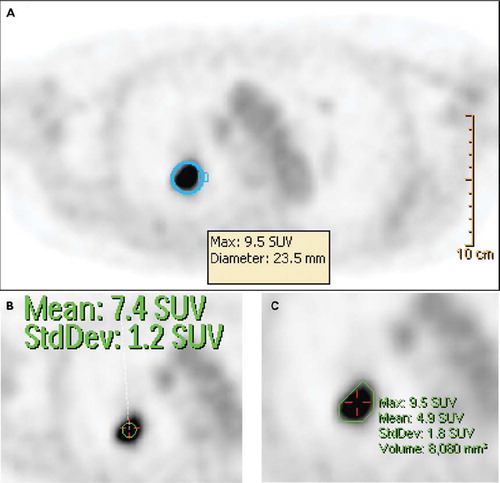
Figure 3. Metabolic tumor response of a biopsy confirmed NSCLC treated by Stereotactic Body Radiation Therapy (SBRT, 60 Gy in 5 fractions). Upper left figure represents PET-CT fusion at baseline; the upper right figure represents metabolic response at three months post completion of SBRT. By visual inspection, the uptake has resolved. The lower figures represent two ways of plotting data gathered by deformable registration-based voxel to voxel mapping. The follow up PET scan was mapped onto the baseline PET to derive voxel specific response data which can be plotted in individual uptake distribution graphs for the two PET scans (lower left), or a scatter plot which tracks uptake changes on a voxel by voxel basis (lower right). The lower left graphs confirm that FDG uptake at three months post SBRT (display in green) is much reduced compared to baseline (red), with SUVmax reduction from 10.7 to less than 2. The lower right scatter plot shows all voxels in blue in which the SUV has decreased by more than 10%. Voxels which show an increase or decrease of 10% over baseline are rendered in green. Voxels that would have an increase in SUV by more than 10% would have been rendered in red in the upper left aspect of the plotted area. In this particular case, virtually all voxels with an initial SUV of 2.5 or higher have decreased to SUV values of 2 or lower. Only voxels with low initial SUV have retained their baseline uptake (green).
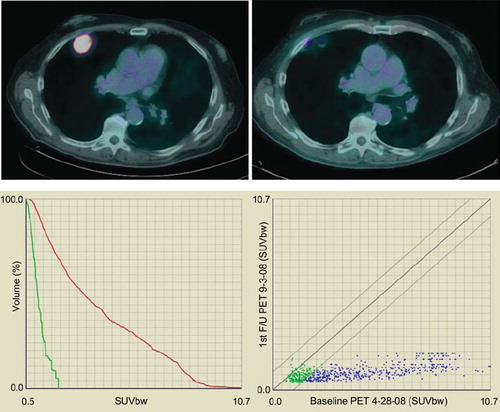
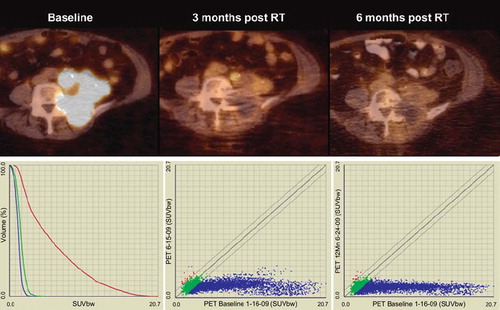
Figure 4. Upper figures represent PET-CT fusion images of a recurrent endometrial cancer at baseline, three months post completion of hypofractioned radiation therapy (45 Gy in 18 fractions), and at six months post radiation therapy. At three months of follow-up a significant response can be assessed visually, but minor uptake remains in a paraaortic tumor nodule. This uptake has resolved at six months, without evidence of tumor recurrence. The lower left figure shows graphs of SUV uptake distribution at baseline (red), first follow-up (green) and second PET-CT follow-up (blue). Not only is SUVmax decreased from a baseline value of 20.7 to 4.6 at three months, and to 3.2 at six months, but also the SUV distribution in general is further decreased with additional follow-up. The lower right figures show voxel by voxel response scatter plots, which indicate a significant response at three months, with further SUV declines later in follow-up. Notable here is again the excellent response of initial high SUV voxels, but also the observation that select voxels with initial low SUV show an increase at early follow-up (red dots; mid figure), with some normalization at later imaging (left figure). This increase in FDG uptake in initial low SUV voxels is preliminarily interpreted to represent inflammatory response with unknown prognostic significance.