Figures & data
Figure 1. Left: Dose average LET as a function of volume. Dotted curves show the minimum and maximum dose averaged LET per voxel in the PTV. Right: LET translated to OER using three different cell lines.
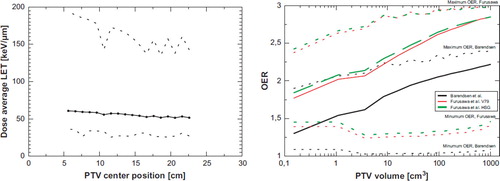
Figure 2. Left column: Configuration 1a. Four flat carbon ion fields. High-LET is distributed on the distal edge of the SOBPs. Right column: Configuration 1b. We here demonstrate “LET-painting”. Four “half PTV”s are used instead, which gives a very different LET and therefore a very different OER distribution – even if the dose distribution is rather equal. “ct [mm]” marks the position in mm along the x and y direction.
![Figure 2. Left column: Configuration 1a. Four flat carbon ion fields. High-LET is distributed on the distal edge of the SOBPs. Right column: Configuration 1b. We here demonstrate “LET-painting”. Four “half PTV”s are used instead, which gives a very different LET and therefore a very different OER distribution – even if the dose distribution is rather equal. “ct [mm]” marks the position in mm along the x and y direction.](/cms/asset/9d0594cc-3c2c-4614-8149-34bd64dd472f/ionc_a_510640_f0002_b.jpg)
Figure 3. Three figures showing the dose, LET and OER of a 10 cm diameter target volume irradiated with protons to 50% dose. The proton beam is entering from the top. Inside the large spherical PTV a 50% boosts are given to two smaller spherical targets of 1 cm diameter. The lower target is irradiated with protons (beam entering from the right) and the upper target is irradiated with carbon ions (beam entering from the right), recognized by the characteristic fragmentation tail. “ct [mm]” marks the position in millimeters in x and y direction.
![Figure 3. Three figures showing the dose, LET and OER of a 10 cm diameter target volume irradiated with protons to 50% dose. The proton beam is entering from the top. Inside the large spherical PTV a 50% boosts are given to two smaller spherical targets of 1 cm diameter. The lower target is irradiated with protons (beam entering from the right) and the upper target is irradiated with carbon ions (beam entering from the right), recognized by the characteristic fragmentation tail. “ct [mm]” marks the position in millimeters in x and y direction.](/cms/asset/8ec23121-4728-4825-b066-bf4104ae838e/ionc_a_510640_f0003_b.jpg)