Figures & data
Figure 1. Time to rib fracture after hypofractionated proton beam therapy [proportion per patient (a) and proportion per irradiated rib (b)]. a) Among 67 patients, 11 (16.4%) developed rib fracture after proton beam therapy. The 5-year cumulative incidence of rib fracture was 22%. b) Among 310 irradiated ribs in all 67 patients, 27 ribs (8.7%) developed fracture, and the 5-year cumulative incidence of rib fracture was 13%.
![Figure 1. Time to rib fracture after hypofractionated proton beam therapy [proportion per patient (a) and proportion per irradiated rib (b)]. a) Among 67 patients, 11 (16.4%) developed rib fracture after proton beam therapy. The 5-year cumulative incidence of rib fracture was 22%. b) Among 310 irradiated ribs in all 67 patients, 27 ribs (8.7%) developed fracture, and the 5-year cumulative incidence of rib fracture was 13%.](/cms/asset/cc260a1c-0814-4080-aafe-4a23a751ea52/ionc_a_718094_f0001_b.gif)
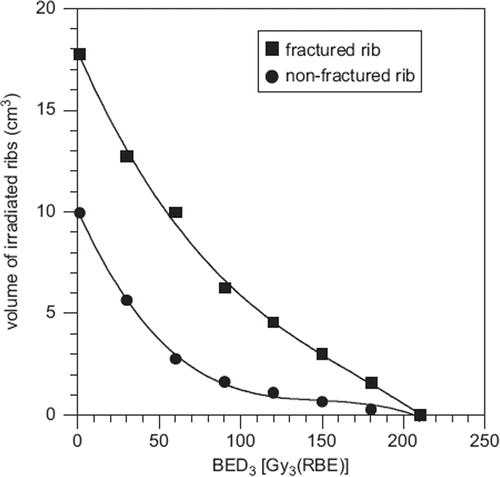
Figure 2. Mean irradiated rib volume and mean biologically effective dose (BED3) to irradiated ribs. DVH parameters were all significantly higher in fractured ribs than in non-fractured ribs (p < 0.05).

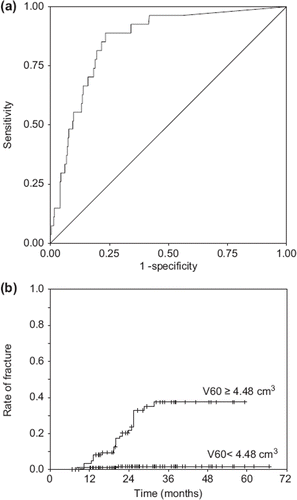
Figure 3. Receiver operating characteristics and rate of rib fracture at V60. (a) Among DVH parameters, the area under the curve was largest for V60. With receiver operating characteristics analysis at V60, the optimal cut-off point was 4.48 cm3. The sensitivity of this point was 0.89 and the specificity was 0.77. (b) Curves of cumulative rates were significantly different between the irradiated volumes <4.48 cm3 and volumes ≥4.48 cm3 according to the log-rank test (p = 0.000).

Table I. The calculated areas under the curve of receiver operating characteristics curves and optimal cut-off point*.
Figure 4. Volume-response curve at V60 (a) and dose-response curves at Dmax (b) and D1cm3 (c). Using logistic regression, each diagram (a)–(c) showed as following. The irradiated volume/dose points of each non-fractured or fractured rib were plotted on the lines y = 0 (non-fractured rib) or y = 1 (fractured rib) with circle both. The estimated volume- or dose-response curves within the range the x-values being observed are solid curve, but those exceeding the range are dotted one. The 68% confidence interval of each curve was drawn by dashed curve. The observed data was divided into three bins [according to each 10 cm3 of V60 for diagram (a), each 100 Gy3 (RBE) of Dmax for diagram (b), and each 100 Gy3 (RBE) of D1cm3 for diagram (c)], and showed the mean (triangle point) and its standard deviation (SD) (mean ± SD was drawn by horizontal line segment) in each bin, respectively. Vertical line segment at each mean showed the 68% confidence interval for the observed probability calculated with binomial statistics. (a) Volume-response curve of the fracture proportion (p), a function of volume of irradiated rib at V60, was estimated by the equation p = 1/{1 + exp[21 × (23.511 + 0.204 × V60)]}. The volume yielding 50% probability was 17.2 cm3, and gamma 50 (representing the steepness of the curve at the point of 50% probability) was 0.88, respectively. b), c) Dose-response curves of the fracture rate (p), functions of dose of irradiated rib at Dmax and D1cm3, were generated using the regression p = 1/{1 + exp[21 × (25.535 + 0.024 × Dmax)]}, and p = 1/{1 + exp[21 × (24.791 + 0.022 × D1cm3)]}, respectively. The doses that yields 50% probability / gamma 50 based on Dmax and D1cm3 were 231 Gy3 (RBE) / 1.38 and 218 Gy3 (RBE) / 1.20, respectively.
![Figure 4. Volume-response curve at V60 (a) and dose-response curves at Dmax (b) and D1cm3 (c). Using logistic regression, each diagram (a)–(c) showed as following. The irradiated volume/dose points of each non-fractured or fractured rib were plotted on the lines y = 0 (non-fractured rib) or y = 1 (fractured rib) with circle both. The estimated volume- or dose-response curves within the range the x-values being observed are solid curve, but those exceeding the range are dotted one. The 68% confidence interval of each curve was drawn by dashed curve. The observed data was divided into three bins [according to each 10 cm3 of V60 for diagram (a), each 100 Gy3 (RBE) of Dmax for diagram (b), and each 100 Gy3 (RBE) of D1cm3 for diagram (c)], and showed the mean (triangle point) and its standard deviation (SD) (mean ± SD was drawn by horizontal line segment) in each bin, respectively. Vertical line segment at each mean showed the 68% confidence interval for the observed probability calculated with binomial statistics. (a) Volume-response curve of the fracture proportion (p), a function of volume of irradiated rib at V60, was estimated by the equation p = 1/{1 + exp[21 × (23.511 + 0.204 × V60)]}. The volume yielding 50% probability was 17.2 cm3, and gamma 50 (representing the steepness of the curve at the point of 50% probability) was 0.88, respectively. b), c) Dose-response curves of the fracture rate (p), functions of dose of irradiated rib at Dmax and D1cm3, were generated using the regression p = 1/{1 + exp[21 × (25.535 + 0.024 × Dmax)]}, and p = 1/{1 + exp[21 × (24.791 + 0.022 × D1cm3)]}, respectively. The doses that yields 50% probability / gamma 50 based on Dmax and D1cm3 were 231 Gy3 (RBE) / 1.38 and 218 Gy3 (RBE) / 1.20, respectively.](/cms/asset/5f20a28a-9a5c-4092-b465-fe381dec9238/ionc_a_718094_f0004_b.gif)