Figures & data
Figure 1. The initial isotropic motion simulations using 10 trials with small (σ = 0.2 cm, upper panel), intermediate (σ = 0.5 cm, middle panel) and large (σ = 0.8 cm, lower panel) motion magnitudes for both random (left) and systematic (right) motion patterns shown for one patient. The planned DVH is included as well (black solid line).
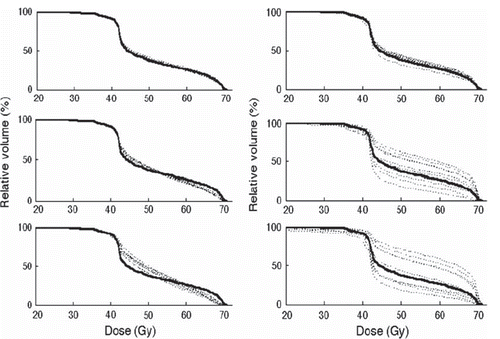
Figure 2. All simulated dDVHs (green) and re-calculated DVHs (black) for the patient with the smallest (left) and largest (right) differences between the average of the dDVHs and the average of the recalculated DVHs obtained for systematic large (σ = 0.8 cm) anisotropic shifts and random large isotropic shifts, respectively. The pDVH is additionally included (red).
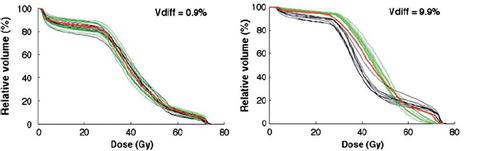
Table I. The largest and smallest relative volume difference between the simulated and re-calculated DVHs (Vdiff (%)) and the related shifts for each patient. In the rightmost column the average of Vdiff over all applied shifts is given for each patient.
Figure 3. The simulation of isotropic motion and the associations of the resulting dDVHs (red) and the pDVH (black) with rectal morbidity quantified by Spearman's rank correlation coefficient (Rs) plotted against the dose (Gy) for random (upper panel), systematic (middle panel) and combined random and systematic motion (lower panel) using σ of 0.2 (left), 0.5 (middle) and 0.8 (right) cm.
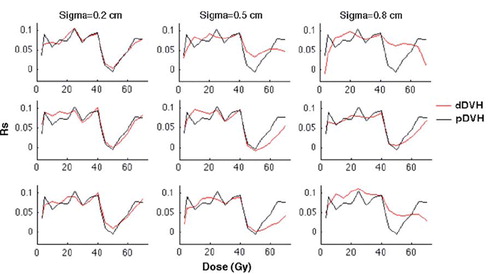
Figure 4. The anisotropic motion pattern giving the Rs-values, plotted against the dose, i.e. the associations between rectal morbidity and the pDVH (black) as well as the dDVHs (red) for random (upper panel), systematic (middle panel) and combined random and systematic motion (lower panel) using σ of 0.2 (left), 0.5 (middle) and 0.8 (right) cm.
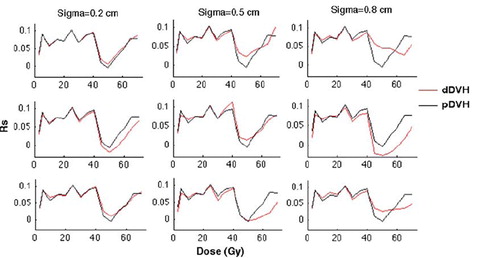
Table II. The associations (Rs) between rectal morbidity and the dDVHs given the 0.02 increase criterion in the Rs-value for the dDVH compared to the Rs-value for the pDVH, summarised for isotropic and anisotropic motion with σ = 0.2, 0.5 and 0.8 cm given for the dose levels (Gy) investigated. The increase in associations was seen especially at intermediate doses (45–60 Gy). Isotropic motion provided stronger associations also at low doses ( ≤ 20 Gy). Applying anisotropic random motion, the associations were stronger also at high doses (≥ 60 Gy).