Figures & data
Table I. Patient characteristics.
Figure 1. Beam orientation in proton plan (top) and starting angles for photon arcs (bottom) for patient no. 3.
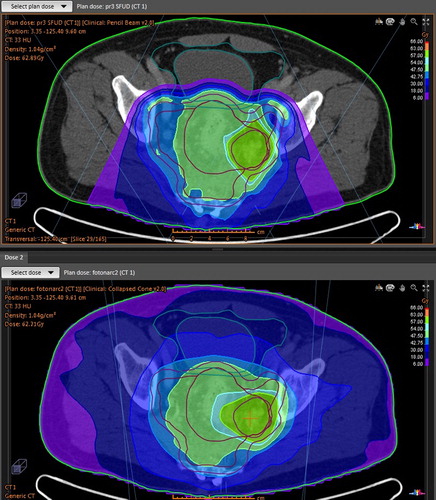
Table II. Planning target volume (PTV) coverage and doses (VMAT stands for photon plan and P+ stands for proton plan).
Table III. Organs at risk (OAR) volumes and doses (VMAT stands for photon plan and P+ stands for proton plan).
Figure 2. Dose volume histogram (DVH) for intestinal cavity for protons (top) and photons (bottom) with critical volumes recommended by Fiorino et al. (18) and Roeske et al. (30) mapped.
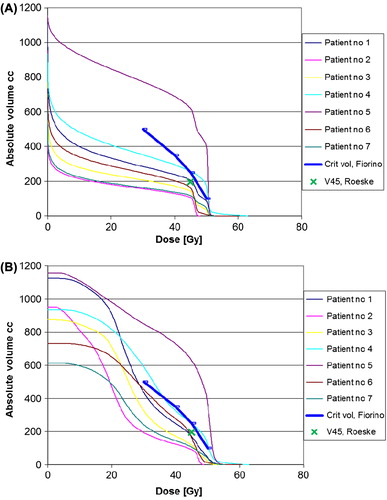
Figure 3. Dose volume histogram (DVH) for intestinal cavity showing mean values for patient 3 and 6, critical volumes recommended by Fiorino et al. (18) and Roeske et al. (30) mapped.
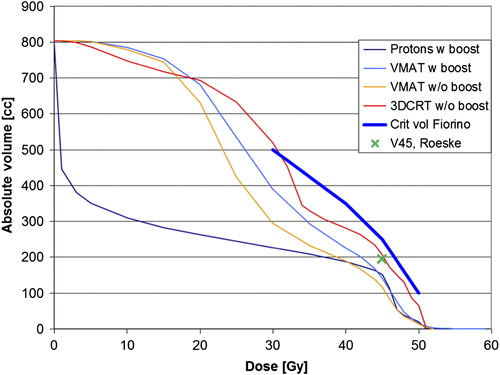
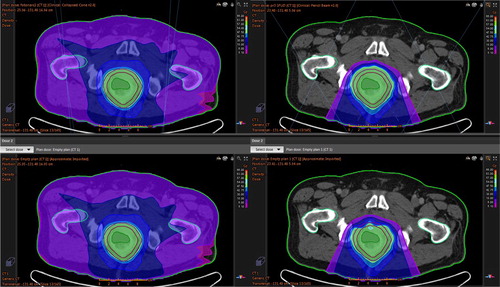
Figure 4. Differences in target coverage – intestinal gas influence in patient no 3. Photon plan to the left and proton plan to the right. Upper row: Dose distribution in the planning CT with gas present. Lower row: Dose distribution when gas is replaced by water in 25 of 25 fractions. It is the distance the protons have to cross in the gas cavity that is important for the robustness of the proton plan.