Figures & data
Figure 1. The blood concentration of Gd-DTPA (a), P846 (b), and gadomelitol (c) in BALB/c nu/nu mice as a function of time after intravenous administration of a bolus dose of 5.0 ml/kg body weight of a 60 mM Gd-DTPA solution or a 7.0 mM solution of P846 or gadomelitol. The points represent blood samples from 10 (a), 13 (b), and 20 (c) mice. One to five blood samples were obtained from each mouse in (a), whereas a single blood sample was obtained from each mouse in (b) and (c). The curves show the best fit of a double exponential function to the blood sample data.
Figure 2. The Ktrans image, Ktrans frequency distribution, ve image, and ve frequency distribution of an A-07 tumor with low IFP (left) and an A-07 tumor with high IFP (right) imaged with Gd-DTPA (a), P846 (b), or gadomelitol (c).
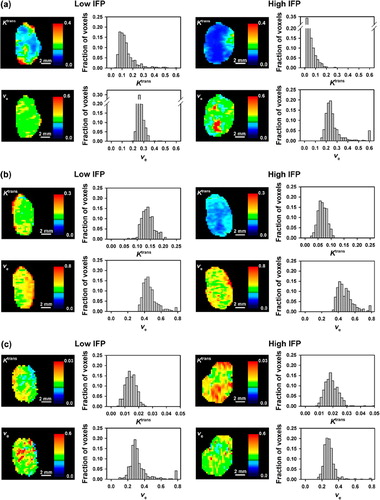
Figure 3. Contrast agent concentration versus time for individual voxels in A-07 tumors imaged with Gd-DTPA (a), P846 (b), or gadomelitol (c). The points refer to measured values, and the curves represent the best fits obtained with the Tofts iso-directional pharmacokinetic model. Data for voxels with high, intermediate, and low contrast enhancement are shown in red, green, and blue, respectively.
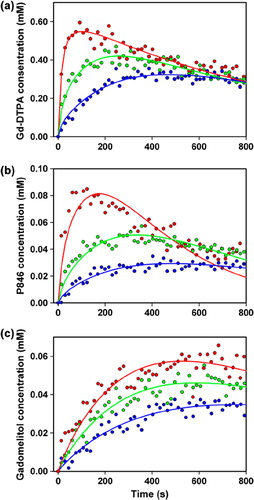
Figure 4. Median Ktrans (left) and median ve (right) versus IFP for A-07 tumors imaged with Gd-DTPA (a), P846 (b), or gadomelitol (c). The points represent individual tumors, and the solid curves were fitted to the data by linear regression analysis. The dashed curves represent the 95% confidence intervals.
Figure 5. Median Ktrans versus IFP for A-07 tumors imaged with P846 for ∼4 min (a), ∼7 min (b), or ∼10 min (c). The points represent individual tumors, and the solid curves were fitted to the data by linear regression analysis. The dashed curves represent the 95% confidence intervals.