Figures & data
Figure 1. Overview of experimental set up. From a common LD18:6 entraining phase at 25 °C, wasps were split into six different conditions nine days before eclosion. On day 5, post-eclosion wasps were collected. Fresh hosts were provided every two days starting from eclosion day. On top, the life stages are indicated. Light and black boxes represent light and dark phases of days.
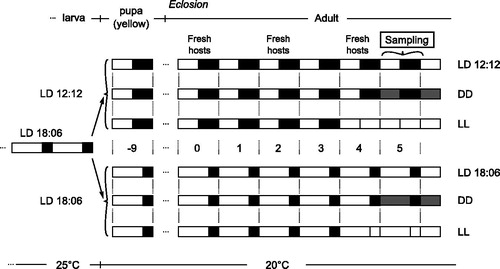
Table 1. Period and cryptochrome sine wave fit parameters. Values represent the essential parameters (amplitude, period, phase, coefficient of determination R2 and p values) and 95% confidence intervals describing the sine wave fitting the oscillation of per and cry mRNAs data.
Figure 2. Per and cry mRNA expression under LD12:12. Relative expression of period (top) and cryptochrome (bottom) mRNA in female Nasonia heads is indicated for every light condition: LD12:12 (left panels), as well as DD (middle) and LL (right) after an LD12:12 light regime. Each dot represents the expression value of a pool of 35 Nasonia heads. The curves represent the best sine wave fit of the experimental data for a fixed period of 24 h (continuous) or a free period (dashed line). Data are plotted according to External Time (Daan & Merrow, Citation2002). Filled bars on the bottom represent light (white and light gray) and dark (black and dark gray) phases. Light-on is at 6 h, light-off at 18 h ExT.
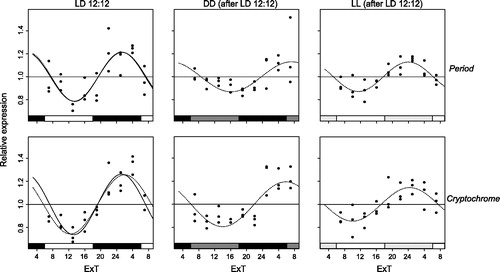
Figure 3. Per and cry mRNA expression under LD18:6. Relative expression of period (top) and cryptochrome (bottom) mRNA in female Nasonia heads is indicated for every light condition: LD18:6 (left panels), as well as DD (middle) and LL (right) after an LD18:6 light regime. Each dot represents the expression value of a pool of 35 Nasonia heads. The curves represent the best sine wave fit of the experimental data for a fixed period of 24 h (continuous) or a free period (dashed line). Data are plotted according to External Time (Daan & Merrow, Citation2002). Filled bars on the bottom represent light (white and light gray) and dark (black and dark gray) phases. Light-on is at 3 h, light-off at 21 h ExT.
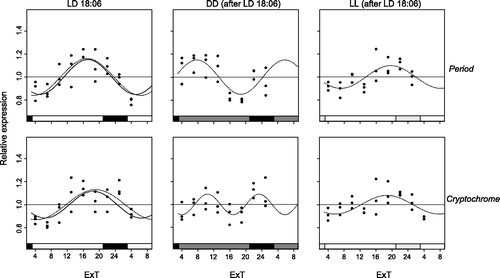
Figure 4. Per and cry mRNA expression tracks light-on. Scheme illustrating how both per and cry mRNA oscillations are set by the light-on signal: by changing photoperiod, the shift (dotted arrows) of any point in the sine wave (here the trough as example) correlates with the shift in the light-on instead of the light-off signal (continuous arrows in the “white-black” light scheme between both plots). Representative graphs are taken here from per. For other details see and .
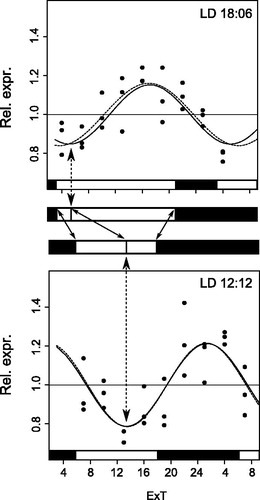
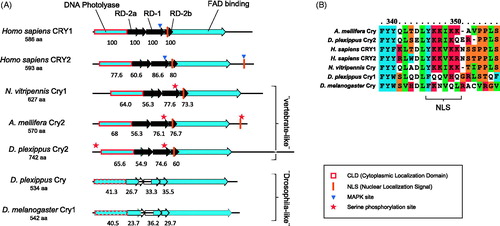
Figure 5. Phylogenetic relationship of Period and Cryptochrome protein sequences. Period (A) and Cryptochrome (B) phylogenetic relationship with homologous proteins in other organisms were reconstructed with Maximum Likelihood (ML) and Bayesian methods. The Cryptochrome tree is rooted on a photolyase found in several taxa, including N. vitripennis. The Period tree is unrooted. Bayesian posterior probability (first) and ML bootstrap values (second) are separated by commas and indicated for relevant branches only when they are greater than 70%. N. vitripennis Cryptochrome is confusingly recorded as “Cryptochrome-1” in NCBI even though it is clearly of the vertebrate type (i.e. Cry2). N. vitripennis proteins are highlighted in bold. For amino acid substitution models see materials and methods. Species and GeneBank accession numbers for sequences used in the analyses can be found in Table S1 (supplementary material).
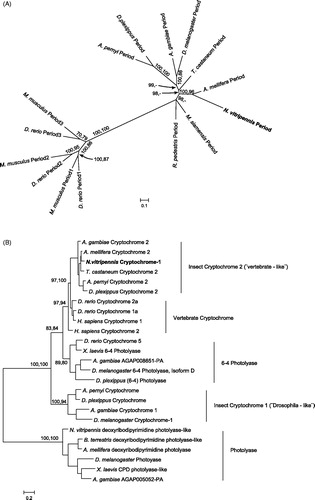
Figure 6. Putative functional domains in several Cryptochrome proteins. Functional domains in Cryptochrome proteins of several species are compared (A). Highlighted is the presence of domains important for vertebrate-like Cryptochromes (Hirayama & Sassone-Corsi, Citation2005) in Cry2 insect proteins, including that of N. vitripennis. Values underneath the domains are percentages of amino acid identity conservation relative to Homo sapiens Cry1 (on top). When identity percentage drops below 50% – as in Cry1 (“drosophila-like”) proteins – the domain is not filled (RD domains) or its contour is dashed (DNA photolyase). Known MAPK Serine phosphorylation sites relevant for vertebrate Crys function are indicated. Homologous Serine phosphorylation sites in insect Crys are indicated with a star. A detail of Cry proteins alignment around the central NLS (B) highlights its presence or absence in different species.