Figures & data
Table 1. Experimental design.
Table 2. Primer design.
Figure 1. Effect of aliskiren treatment on SOD activity in the rats’ kidney tissues. ALI: aliskiren, I/R: ischemia/reperfusion. Notes: Means in the same column by the same letter are not significantly different to the test of Duncan (p = 0.05). Results are means ± SD.
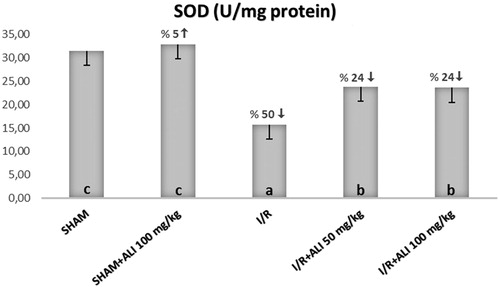
Figure 2. Effect of aliskiren treatment on GSH levels in the rats’ kidney tissues. ALI: aliskiren, I/R: ischemia/reperfusion. Notes: Means in the same column by the same letter are not significantly different to the test of Duncan (p = 0.05). Results are means ± SD.
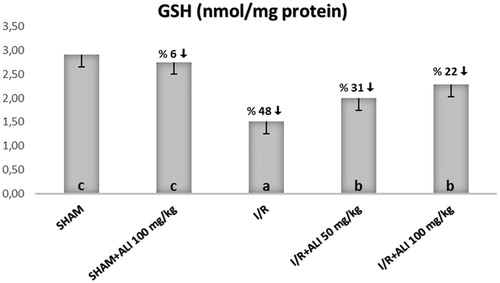
Figure 3. Effect of aliskiren treatment on MDA levels in the rats’ kidney tissues. ALI: aliskiren, I/R: ischemia/reperfusion. Notes: Means in the same column by the same letter are not significantly different to the test of Duncan (p = 0.05). Results are means ± SD.
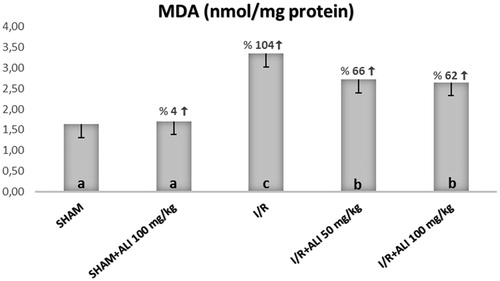
Figure 4. Effect of aliskiren treatment on serum BUN levels in rats. Notes: ALI: aliskiren, I/R: ischemia/reperfusion. Means in the same column by the same letter are not significantly different to the test of Duncan (p = 0.05). Results are means ± SD.
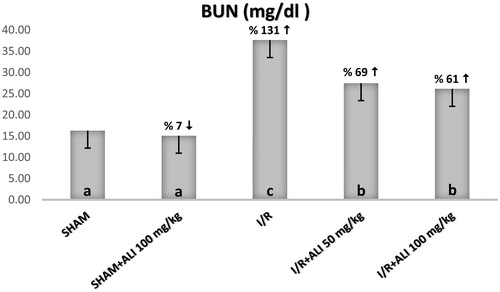
Figure 5. Effect of aliskiren treatment on serum creatinine levels in rats. Notes: ALI: Aliskiren, I/R: ischemia/reperfusion. Means in the same column by the same letter are not significantly different to the test of Duncan (p = 0.05). Results are means ± SD.
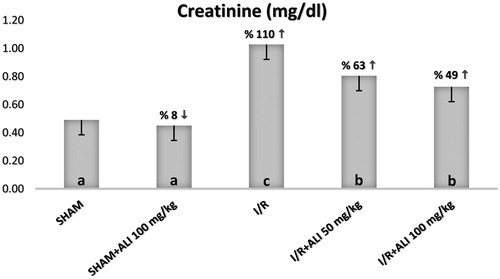
Figure 6. Effect of aliskiren treatment on serum renin levels in rats. Notes: ALI: aliskiren, I/R: ischemia/reperfusion. Means in the same column by the same letter are not significantly different to the test of Duncan (p = 0.05). Results are means ± SD.
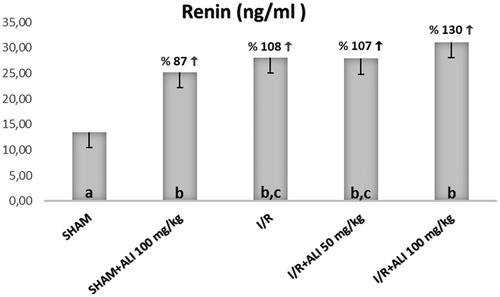
Figure 7. Effect of aliskiren treatment on serum angiotensin II levels in rats. Notes: ALI: aliskiren, I/R: ischemia/reperfusion. Means in the same column by the same letter are not significantly different to the test of Duncan (p = 0.05). Results are means ± SD.
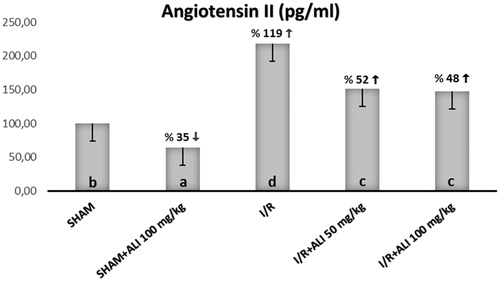
Figure 8. Effects of aliskiren treatment on relative mRNA expression levels of IL-1β in rats’ kidney tissues. Notes: Expressions of mRNAs were detected by quantitative real time PCR analysis. β-actin was used as the reference gene. Gene-specific probes were used as outlined under “Material and methods”. The relative expression levels were calculated by the 2−ΔΔCT method. ALI: aliskiren, I/R: ischemia/reperfusion. Values of all significant correlations are given with degree of significance indicated (*p < 0.05, ***p < 0.0001).
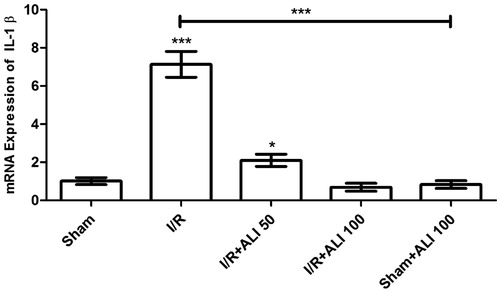
Figure 9. Effects of aliskiren treatment on relative mRNA expression levels of iNOS in rats’ kidney tissues. Notes: Expressions of mRNAs were detected by quantitative real time PCR analysis. β-actin was used as the reference gene. Gene-specific probes were used as outlined under “Material and methods”. The relative expression levels were calculated by the 2−ΔΔCT method. ALI: aliskiren, I/R: ischemia/reperfusion. Values of all significant correlations are given with degree of significance indicated (***p < 0.0001).
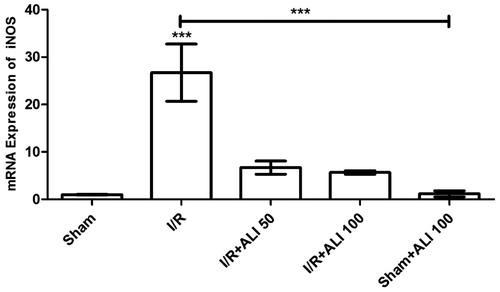
Figure 10. Effects of aliskiren treatment on relative mRNA expression levels of NFkB in rats’ kidney tissues. Notes: Expressions of mRNAs were detected by quantitative real time PCR analysis. β-actin was used as the reference gene. Gene-specific probes were used as outlined under “Material and methods”. The relative expression levels were calculated by the 2−ΔΔCT method. ALI: aliskiren, I/R: ischemia/reperfusion. Values of all significant correlations are given with degree of significance indicated (*p < 0.05, ***p < 0.0001).
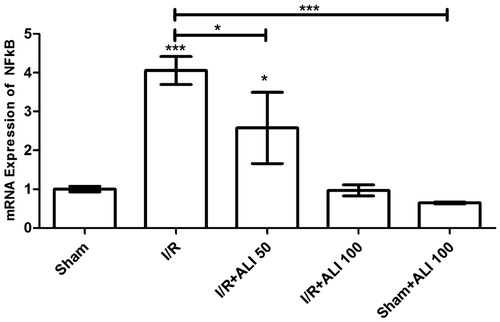
Figure 11. (Sham Group) (A) Light microscopy of a glomerulus demonstrating typically glomerular (g) structures. Podocyte, mesangial cell appear clear (arrow). Capsular spice is shown (s). H&E stain. (B) Light microscopy of medullar region. Tubular (t) structure and tubular basement membrane (tailed arrow) appear clear. H&E stain. (C) Kidneys showing typically structured tubules (t) and glomeruli (g). Tubular basement membrane clear appeared (arrow head). Capsular spice is shown (s). Podocyte (arrow), mesangial cell (curved arrow) appear clear PAS stain, 10×.
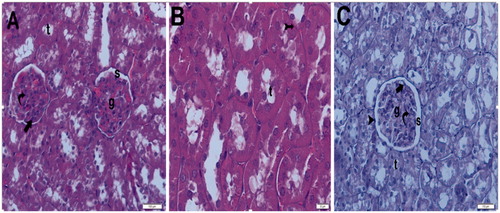
Figure 12. (Sham + aliskiren 100 mg/kg) (A) Light microscopy of a glomerulus demonstrating normal thickening of the glomerular capillary wall. Podocyte (arrow) and mesangial cell (curved arrow). Typical capsular spice (s) and tubular structure (t). H&E stain. (B) Light microscopy of a glomerulus demonstrating normal glomerular structure and typical bowman space (arrow). Typical tubular basement membrane (tailed arrow). H&E stain.
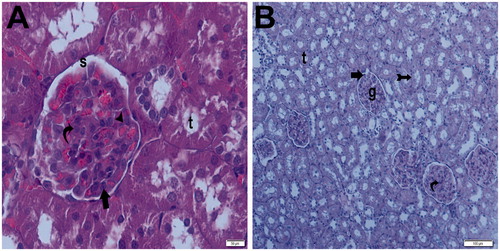
Figure 13. (Ischemia/reperfusion group) (A) Light microscopy of a glomerulosclerosis (spiral arrow) demonstrating and Bowman’s space lose (arrow). Many tubules show dense hyaline casts (arrow head). H&E stain. (B) Light microscopy of a glomerulosclerosis (spirally arrow) demonstrating and Bowman’s space lose (arrow). Many tubules show dense hyaline casts (arrow head). H&E stain. (C) Light microscopy of a glomerulosclerosis (spirally arrow). Many tubules show necrotic tubules (arrow head). H&E stain. (D) Light microscopy of a many tubules showing dense hyaline casts (arrow head).H&E stain. (E) Light microscopy of a glomerulosclerosis (spirally arrow) demonstrating and Bowman’s space lose (arrow). Many tubules show dense hyaline casts (arrow head). PAS stain. (F) Light microscopy of a glomerulosclerosis (spirally arrow) demonstrating and Bowman’s space lose (arrow). Many tubules show dense hyaline casts (arrow head). PAS stain.
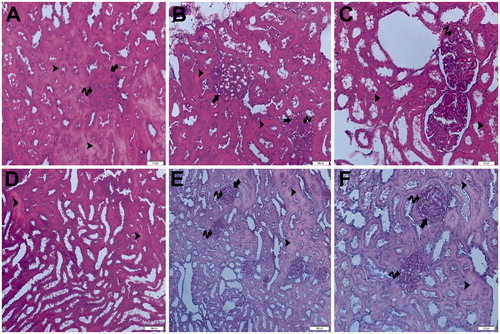
Figure 14. (Ischemia/reperfusion + aliskiren 50 mg/kg). (A) Light microscopy of a glomerulus demonstrating normal thickening of the glomerular capillary wall (arrow head) and typical podocyte (arrow), mesangial cell (curved arrow). Parietal endothelial cell (tailed arrow). Typical capsular spice (S). H&E stain. (B) Light microscopy of demonstrating normal tubular (t) structure. H&E stain. (C) Light microscopy of a glomerulus demonstrating normal thickening of the glomerular capillary wall (arrow head) and typical podocyte (arrow), mesangial cell (curved arrow). Tubular basement membrane appears clear (tailed arrow). Typical capsular space (s). Kidney medulla showing normal tubular structure (t) PAS stain.
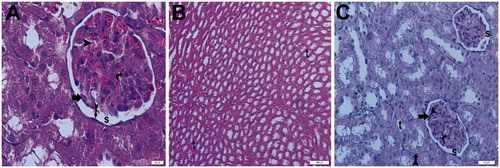
Figure 15. (Ischemia/reperfusion + aliskiren 100 mg/kg) (A) Light microscopy of a glomerulus (g) demonstrating normal glomerular structure and typical podocyte (arrow), mesangial cell (curved arrow). Typical capsular space (s). Normally tubular structure (t). H&E stain. (B) Light microscopy of a glomerulus demonstrating normal glomerular structure and typical podocyte (arrow), mesangial cell (curved arrow). Typical capsular space (s). Normally tubular structure (t). H&E stain. (C) Light microscopy of a glomerulus demonstrating normal glomerular structure and typical podocyte (arrow), mesangial cell (curved arrow). Typical capsular space (s) and normally tubular structure (t). Tubular basement membrane appears clear (tail arrow). Typical parietal epithelial cell (arrow head) H&E stain. (D) Light microscopy of a glomerulus demonstrating normal glomerular structure and typical podocyte (arrow), mesangial cell (curved arrow). Typical capsular space (s) and normal tubular structure (t). Tubular basement membrane appears clear (tail arrow). PAS stain.
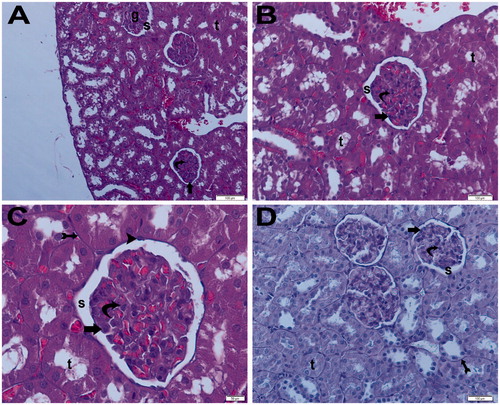
Figure 16. (Electron micrographs show sham group ultrastructure). Electron micrographs showing peritubular capillary with normal basal lamina (arrow head) in a control. Electron microscopic findings show typical podocyte foot process (arrow). Capillary (c). Erythrocyte 3000×.
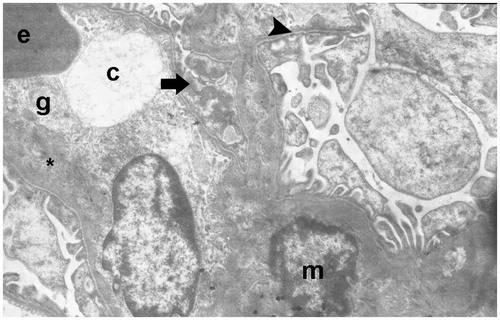
Figure 17. (Electron micrographs show Sham + aliskiren 100 mg/kg group ultrastructure). Electron micrographs showing a glomerular capillary (asterisk) with normal basal lamina and podocyte foot process (arrow head). Electron microscopic findings show typical parietal epitalial cell (Ep). Erythrocyte (e). Capillary (asterisk). Podocytes (P). Bowman’s capsular space (s). 25,000×.
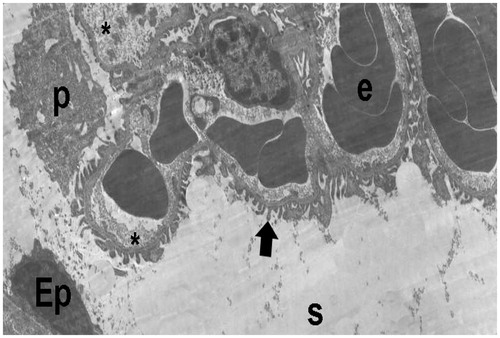
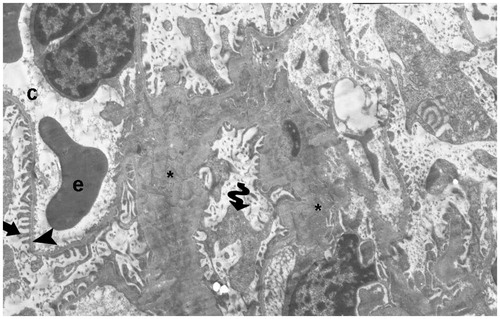
Figure 18. (Electron micrographs show ischemia–reperfusion group ultrastructure). Electron micrographs showing a glomerulosclerosis. Capillary basement membrane lamina densa, lamina rara interna and externa disappear (arrow head). Necrotic podocytes (p) and mesangial cell (m). Podocytes infolding (arrow). Necrotic paritel epithelial cell (Ep). Vacuoles in the cytoplasm of the parietal epithelial cells (tailed arrow). Small vacuoles in capillary basement membrane (spiral arrow). Capillary (c). Mesangial cell (m). Necrotic tubules (t). 15,000×.
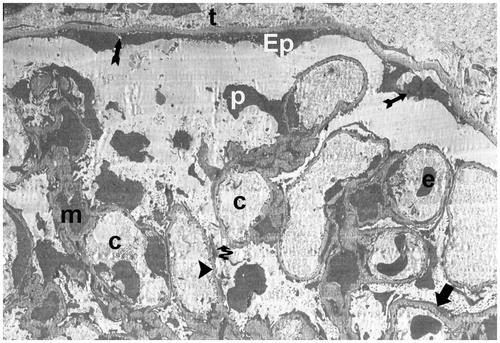
Figure 19. (Electron micrographs show ischemia/reperfusion + aliskiren 50 mg/kg group ultrastructure). Electron micrographs showing a glomerular capillary with normal basal lamina (arrow head). Capillary basement membrane lamina densa, lamina rara interna and externa clear appear (arrow). Electron microscopic findings show typical podocytes (p) and foot process (arrow). Erythrocyte (e). Bowman’s capsular space (s). 15,000×.
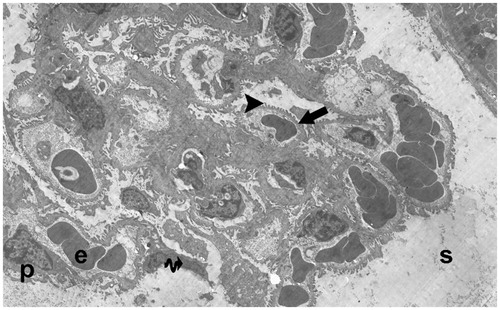
Figure 20. (Electron micrographs show ischemia–reperfusion + aliskiren 100 mg/kg group ultrastructure). Electron micrographs showing glomerular capillary (c) with normal basal lamina (arrow head). Electron microscopic findings show typical podocytes (p) and foot processes (arrow). Mesangial cell (m). Erythrocyte (e). Typical parietal epitalial cell (Ep). 10,000×.
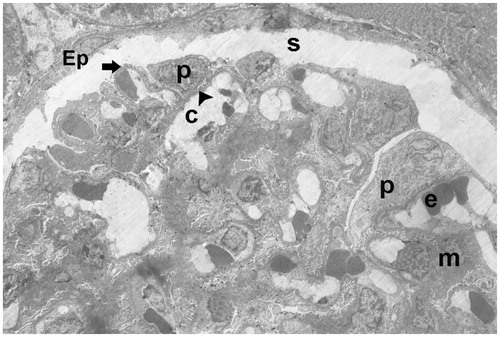
Figure 21. (Electron micrographs show ischemia–reperfusion + aliskiren 100 mg/kg group ultrastructure). Electron micrographs showing glomerular capillary (c). Capillary basement membrane (arrow head) lamina densa, lamina rara interna and externa appear clear. Electron microscopic findings show typical podocytes (spirally arrow) foot processes (arrow). Erythrocyte (e). 4000×.