Figures & data
Figure 1. The levels of serum MDA (A), SOD (B), AOPP (C), IL-1β (D), FT3 (E), and TSH (F) in each group. Data are given as mean ± SD of four animals per group. #p < 0.05 compared with Blank group. *p < 0.05 compared with 5/6 Nx group.
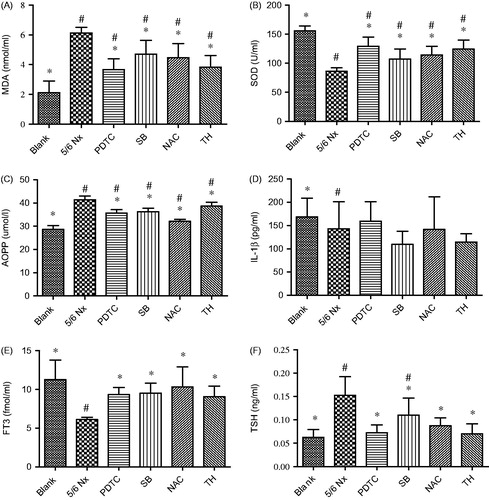
Table 1. The levels of serum MDA, SOD, AOPP, IL-1β, FT3, and TSH in each group.
Figure 2. Effects of PDTC, SB, NAC, and TH treatments on uremic rats by western blot. Normalized densitometric data of IL-1β (A) and DIO1 (B) bands obtained from the protein extractions. RR stands for relative ratio. Values are expressed as fold changes relative to the appropriate controls. Values are given as mean ± SD of four animals per group. #p < 0.05 compared with Blank group. *p < 0.05 compared with 5/6 Nx group.
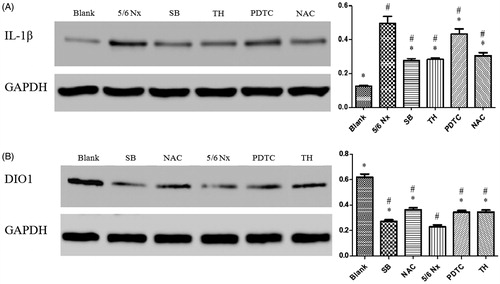
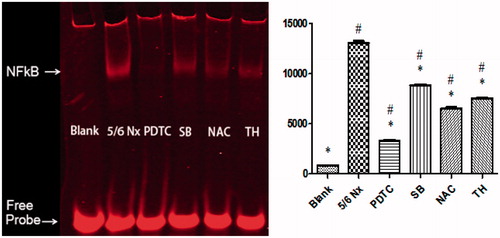
Figure 3. Effects of PDTC, SB, NAC, and TH treatments on uremic rats by EMSA. Normalized densitometric data of NF-κB band obtained from the extracts of proteins with unclear interaction. Data are given as mean ± SD of 4 animals per group. #p < 0.05 compared with Blank group. *p < 0.05 compared with 5/6 Nx group.