Figures & data
Figure 1. Functional characterization of GtrV Loop 2 deletions. (A) Schematic representation of the segments deleted within periplasmatic Loop 2 of GtrV (yellow). The first and last residues of each deleted segment are represented. Note that GtrVWT-PhoA-LacZα was used as template and that the fused dual reporter proteins are not represented. (B) The positive control (+ control) corresponds to the signal given by pNV1709 in SFL1616 cells. The negative control (- control) corresponds to the signal given by SFL1616. LPS was detected by Western immunoblotting using type V antisera. Slide agglutination results using type V antisera are indicated by (+) and (-) according to occurrence or not of agglutination, respectively. (C) Coloration of XL1-Blue MRF' recombinant colonies when patched onto DI plates. Blue is indicative of protein assembly. Results from (B) and (C) are representative of the phenotypes observed in at least three independent experiments. (This Figure is reproduced in colour in Molecular Membrane Biology online.)
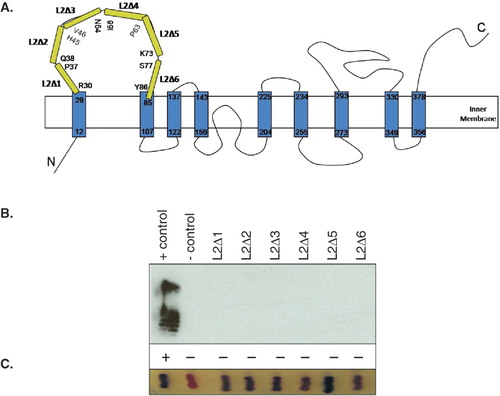
Figure 2. Identification of conserved residues in Loop 2 of GtrV and functional characterization. (A) GtrV, GtrX and the first three proteins of Supplementary Table IV were aligned using ClustalW (Larkin et al. Citation2007). The identical amino acids are highlighted in grey boxes; dashed boxes indicate conserved substitutions. The first two transmembrane segments of GtrV are indicated in the bottom of each line by filled bars. The previously identified E42 and D43 critical residues (Korres & Verma Citation2006) are underlined. Asterisks indicate the residues that were subjected to site-directed mutagenesis in GtrV. (B) Functional characterization of GtrV-PhoA-LacZα derivatives carrying mutation of Loop 2 residues. Plasmids were transformed into electrocompetent SFL1616 cells. The positive control (+ control) corresponds to the signal given by pNV1708 in SFL1616 cells. The negative control (- control) corresponds to the signal given by SFL1616. LPS was detected by Western immunoblotting using type V antisera. Slide agglutination results using type V antisera are indicated by (+) and (-) according to occurrence or not of agglutination, respectively. (C) Coloration of XL1-Blue MRF' recombinant colonies on DI plates. Blue is indicative of protein assembly. Results from (B) and (C) are representative of the phenotypes observed in at least three independent experiments. (This Figure is reproduced in colour in Molecular Membrane Biology online.)
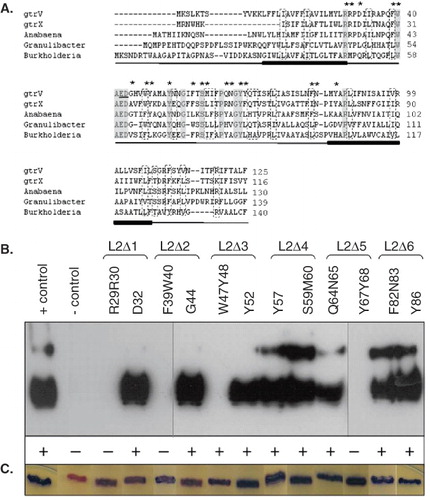
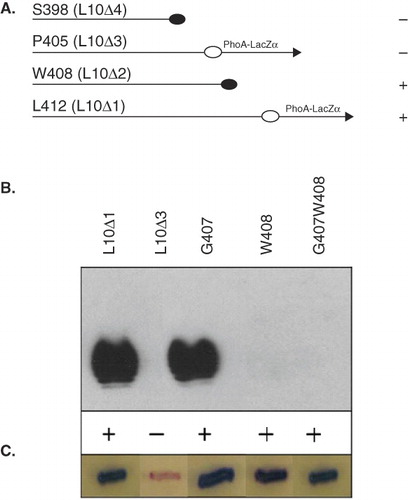
Figure 3. Functional characterization of the C-terminal region of GtrV. Signals (+) and (-) indicate occurrence or not of agglutination with type V antisera. Plasmids were transformed into electrocompetent SFL1616 cells. (A) Diagram showing the different length of the C-terminal truncations and the ability of the GtrV derivatives to mediate serotype conversion. Constructs are represented by the C-terminal region. Truncations are designated by the last GtrV amino acid before the PhoA-LacZα fusion (arrow) or stop codon incorporation (filled circles). (B) LPS detected by Western immunoblotting and agglutination results using type V antisera. (C) Coloration of XL1-Blue MRF' recombinant colonies on DI plates; blue is indicative of protein assembly. Results from (B) and (C) are representative of the phenotypes observed in at least three independent experiments. (This Figure is reproduced in colour in Molecular Membrane Biology online.)