Figures & data
Table 1. Experimental groups.
Figure 1. Social defeat stress induces avoidance behaviors in adolescent c57BL/6 male mice. (a) Schematic of the social interaction/avoidance arena illustrating the geographic location and size of the interaction zone and corner zones with respect to the enclosure (circular wire cage) in which a social target (CD1 mouse) is positioned. (b) Control (non-stressed; n = 10) mice showed significantly higher levels of interaction time (p < 0.05), whereas defeated mice (n = 10) spent significantly less time interacting (p < 0.05), in the presence of a social target. (c) This avoidance behavior as a result of social defeat stress was also evident when assessing time in the corner zones, in which defeated (stressed) mice spent significantly more time in the corner zones in the presence of the social target (p < 0.05). (d) No differences in locomotor activity (distance traveled in cm) during the first 2.5 min of the social interaction test was observed between the groups (p > 0.05). *p < 0.05, within group comparison (presence versus absence of social target). Ψp < 0.05, between group comparison (control versus defeated). Data are presented as mean + SEM.
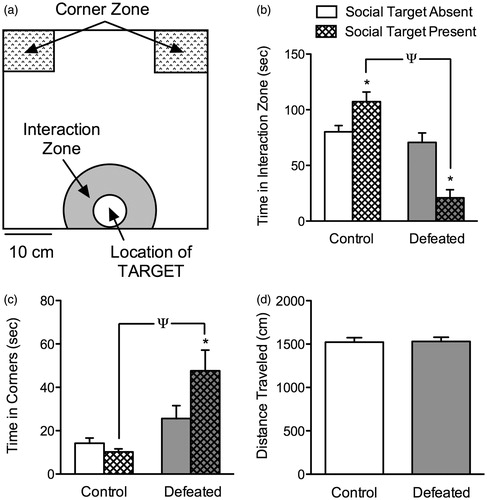
Figure 2. Effects of adolescent social defeat stress on forced swimming behavior, 24 h after the last defeat episode (postnatal day 45). Defeated (stressed; n = 10) adolescent mice exhibited a depressive-like behavior as inferred by (a) lower time to adopt an initial posture of immobility and conversely (b) spending significantly more time in the immobile position, when compared to control (non-stressed; n = 8) mice. *Significantly different from controls (p < 0.05). Data are presented as mean time (s) + SEM.
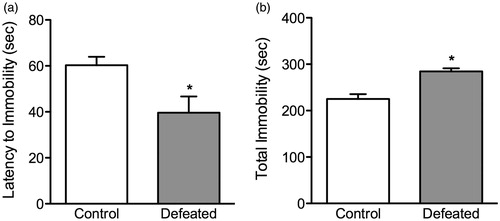
Figure 3. Effects of social defeat stress on sucrose preference in adolescent male c57BL/6 mice. (a) Twenty-four hours after social defeat (postnatal day 45), stressed (defeated; n = 12) adolescent mice displayed a decreased preference for a 1% sucrose solution, when compared to control (non-stressed; n = 10) mice. (b) No differences in total liquid intake (sucrose + water) were detected between the groups. *Significantly different from controls (p < 0.05). Data are presented as percentage or total mL consumed (mean + SEM).
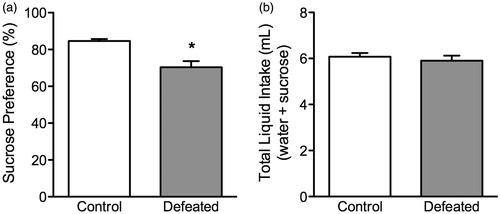
Figure 4. Effects of 10 days of adolescent social defeat stress on anxiety-like behavior in the elevated plus-maze. Twenty-four hours after the last social defeat episode, the stressed (defeated; n = 7) mice spent (a) significantly more time (s) in the closed arms, (b) while spending less time in the open arms of the maze, when compared to control (non-stressed; n = 9) mice. (c) No differences in the total distance (cm) traveled within the 5 min test were observed between the groups (p > 0.05). *Significantly different from controls (p < 0.05). Data are presented as mean time (s) and distance traveled (cm) + SEM.
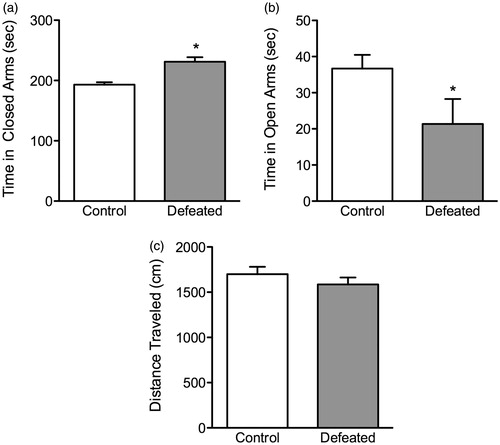
Figure 5. Effects of social defeat stress on body weight gain in adolescent male c57BL/6 mice. Social stress (postnatal day 35–44) resulted in significantly lower body weight gain across days of social defeat, starting on day 2 of stress exposure, when compared to non-stressed (control) mice (n = 10 per group). Body weight remained significantly decreased in the defeated group 24 h after the last day of stress exposure (postnatal day 45). Arrow indicates day of behavioral testing. *Significantly different when compared to controls (p < 0.05). Data are presented as weight change in grams (mean + SEM).
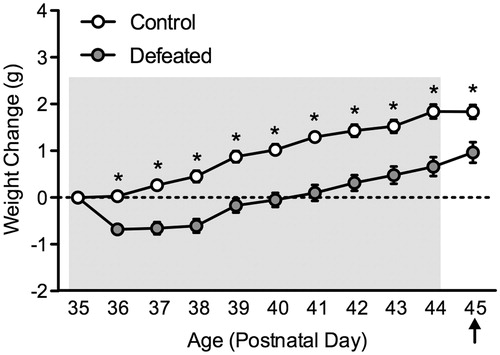
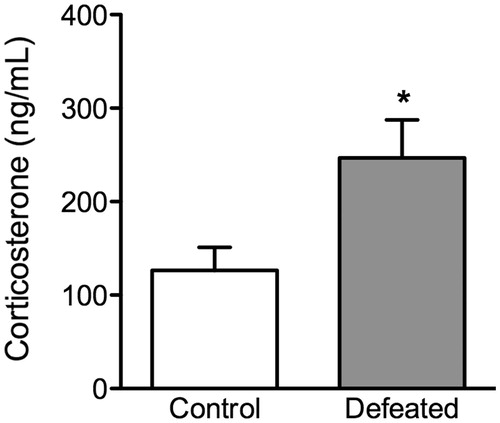
Figure 6. Effects of social defeat stress on adolescent neuroendocrine stress response. (a) Trunk blood of c57BL/6 mice was taken 40 min after the 10th episode of social defeat stress (i.e. postnatal day 44). Adolescent mice exposed to social defeat stress (defeated; n = 9) displayed significantly increased serum corticosterone levels when compared to non-stressed mice (control; n = 10). Data are presented as concentrations in ng/mL. *Significantly different than control mice (p < 0.05). Data are presented as mean + SEM.