
Figures & data
Figure 1. Fold increase of plasma epinephrine and norepinephrine induced by operation and hypoxia. The results were expressed as the fold increase of plasma epinephrine or norepinephrine level in operated rats relative to normal rats. Mean ± SD. n = 7 rats in each group. **p < 0.01 versus corresponding normal adult or aged rats; ##p < 0.01 versus operated adult.
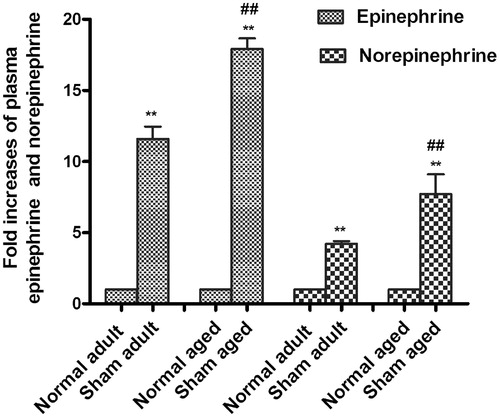
Table 1. Operation and hypoxia elevated plasma epinephrine and norepinephrine.
Figure 2. Combined use of selective β1AR antagonist and β2AR agonist increased the survival rate of myocytes. Each value represents the mean ± SD. n = 7 rats in each group. **p < 0.01 versus normal group; ##p < 0.05 versus surgery group; Δp < 0.05 and ΔΔp < 0.01 versus group.
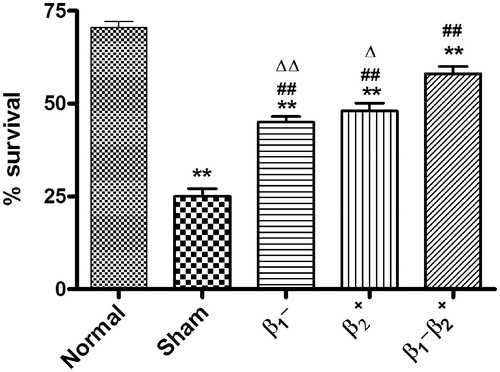
Figure 3. Combined use of selective β1AR blocker and β2AR agonist smoothed the fluctuations of MAP and HR in the perioperative period. a: Changes in MAP in the perioperative period. b: Changes in HR in the perioperative period. Each value represents the mean ± SD. n = 10 rats in each group. *p < 0.05 versus normal group at corresponding time point; #p < 0.05 versus surgery group at corresponding time point; $p < 0.05 versus group at corresponding time point; Δp < 0.05 versus
group at corresponding time point. Pre: day 3 after administration (pre-operation); Ope: intra-operation; Day 1: day 1 after surgery; Day 3: day 3 after surgery; Day 7: day 7 after surgery.
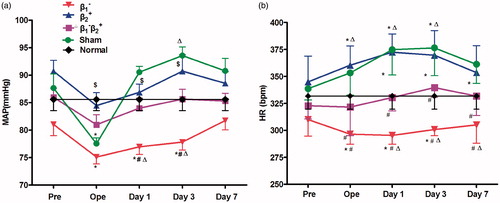
Figure 4. Combined use of selective β1AR blocker and β2AR agonist normalized RPP in the perioperative period. Each value represents the mean ± SD. n = 10 rats in each group. *p < 0.05 versus normal group at corresponding time point; #p < 0.05 versus surgery group at corresponding time point; $p < 0.05 versus group at corresponding time point; Δp < 0.05 versus
group at corresponding time point. Pre: day 3 after administration (pre-operation); Ope: intra-operation; Day 1: day 1 after surgery; Day 3: day 3 after surgery; Day 7: day 7 after surgery.
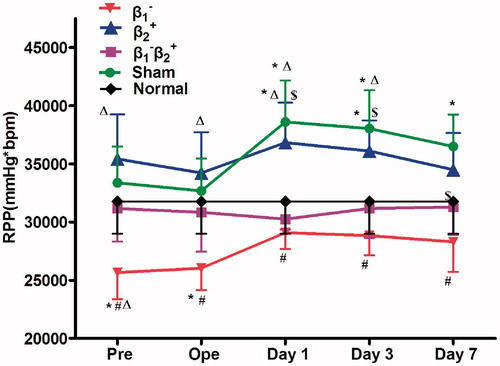
Figure 5. Combined use of selective β1AR blocker and β2AR agonist decreased the release of LDH in the perioperative period. Each value represents the mean ± SD. n = 10 rats in each group. *p < 0.05 versus normal group at corresponding time point; #p < 0.05 versus surgery group at corresponding time point; Pre: day 3 after administration (pre-operation); Ope: intra-operation; Day 1: day 1 after surgery; Day 3: day 3 after surgery; Day 7: day 7 after surgery.
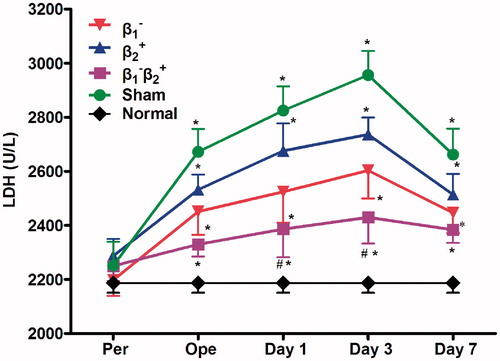
Figure 6. Combined use of selective β1AR blocker and β2AR agonist improved LVEDP and ±dP/dtmax in the perioperative period. a: Changes in LVEDP in each group. b: Changes in +dp/dtmax in each group. c: Changes in −dp/dtmax in each group. Each value represents the mean ± SD. n = 10 rats in each group.*p < 0.05 versus normal group at corresponding time point; #p < 0.05 versus surgery group at corresponding time point; $p < 0.05 versus at corresponding time point; Pre: day 3 after administration (pre-operation); Ope: intra-operation; Day 1: day 1 after surgery; Day 3: day 3 after surgery; Day 7: day 7 after surgery.
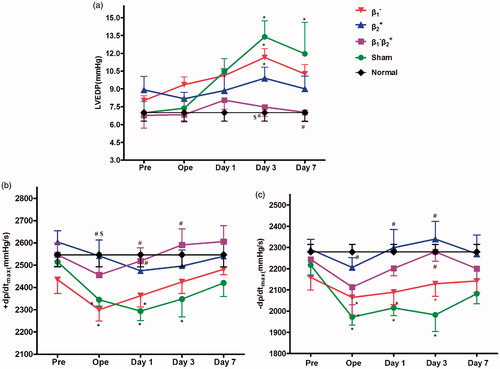
Figure 7. Selective β1AR blocker or/and β2AR agonist changed myocytes shortening amplitudes in the perioperative period. Each value represents the mean ± SD. n = 7 rats in each group. *p < 0.05 versus normal group at corresponding time point; #p < 0.05 versus surgery group at corresponding time point; $p < 0.05 versus group at corresponding time point; Pre: day 3 after administration (pre-operation); Day 1: day 1 after surgery; Day 3: day 3 after surgery; Day 7: day 7 after surgery.
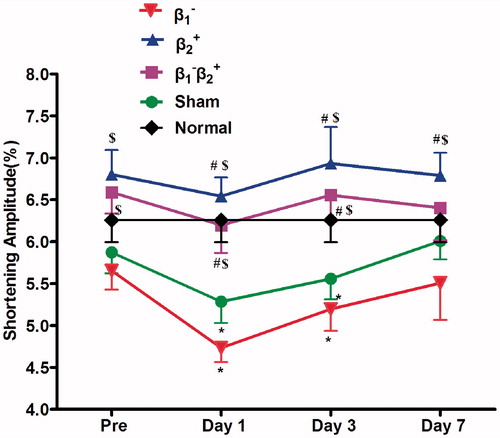
Table 2. The time to peak contraction (TTP, ms) of cardiomyocytes.
Table 3. The time to 90% relaxation (R90, ms) of cardiomyocytes.
Figure 8. ECG recorded from extremities in standard lead II. a: Normal ECG; b: Ventricular bigeminy occurred in surgery group; c: Ventricular trigenimy occurred in surgery group; d: Frequent premature ventricular contractions occurred in surgery group; e: Myocardial ischemia occurred in surgery group; f: Paroxysmal ventricular tachycardia occurred in group.
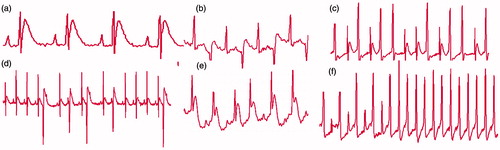
Table 4. The rate of cardiac complications.