Figures & data
Figure 1. Plasma CORT levels during the CRS regimen. Restraint stress caused plasma CORT concentration to significantly increase from basal levels (hour 0) on days 1, 10, and 21 of CRS. *p < 0.05 versus basal levels at hour 0; ‡p < 0.05 versus days 10 and 21.
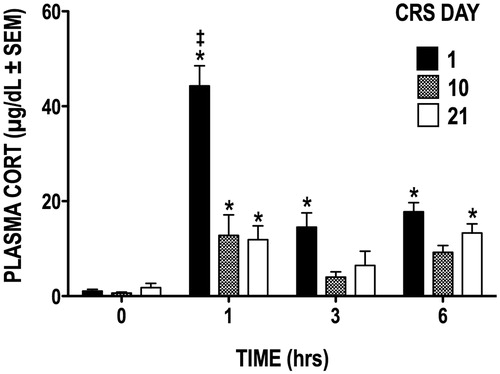
Figure 2. (A–D) Retrograde microbead tracer injections in the PL- and IL-PFC. (A and B) Fluorescence photomicrographs of microbead tracer deposits within the PL-PFC (A) and IL-PFC (B) of the same animal. (C) Digital image showing examples of DAPI-stained IL-PFC cell bodies (blue) retrogradely labeled with red microbead tracer. Scale bar = 20 µm. (D) Schematic reconstruction of the maximum (black) and minimum (shaded) spread of microbead tracer injections within the PFC of control and CRS animals.
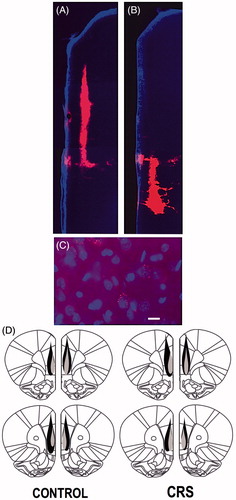
Figure 3. (A–H) Effect of CRS on apical dendritic morphology of callosal neurons. (A and B) Photomicrograph of LY-filled callosal neuron in layer II/III of IL-PFC (A) and resulting computer-assisted morphometric reconstruction (B). Scale bars = 50 μm. The apical dendritic tree points downward toward the midline. The dashed circle delineates the 150 μm boundary between the proximal and distal extents of the apical arbor. (C and D) CRS significantly decreased length (C) and branching (D) of apical dendrites in both the left and the right PFC. (E–H) There was no difference in length at any radial distance between left and right callosal neurons in either control (E) or CRS (F) animals. CRS decreased the length of distal dendrites in the left PFC (G), while in the right PFC both proximal and distal dendritic lengths were reduced (H). In this and subsequent figures, *p < 0.05, **p < 0.01, versus unstressed controls.
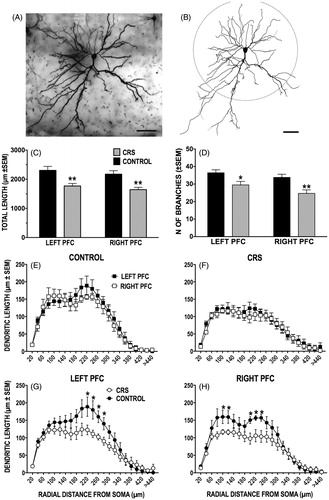
Figure 4. (A and B) Effect of CRS on apical dendritic spine density of callosal neurons. (A) Photomicrographs of dendritic spine density from callosal neurons in the left and right PFC of control and CRS animals. Scale bar = 5 μm. (B) CRS resulted in a significant overall decrease in spine density in both the left and the right PFC. Spine loss was more pronounced in left PFC neurons, particularly within the distal (>150 μm) dendritic arbor.
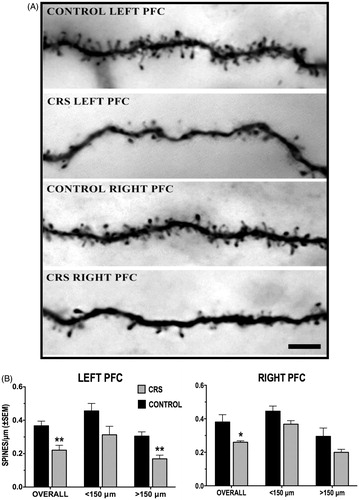
Figure 5. Effect of CRS on the overall spine density of callosal neurons located in the PL and IL subregions of the left and right PFC. Also shown are the pooled left and right hemisphere data for each subregion. *p < 0.05 versus corresponding control group.
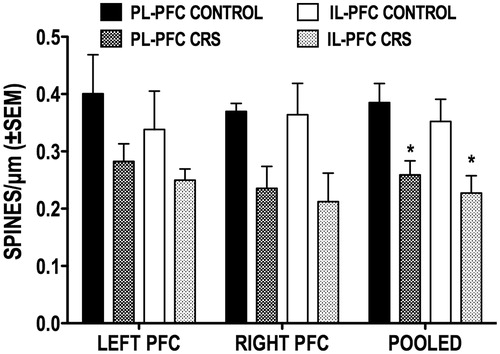
Figure 6. (A–G) Effect of CRS on the density of dendritic spine subtypes. (A) Photomicrograph of a dendritic segment with examples of thin, stubby and mushroom-shaped spines. Scale bar = 5 μm. (B and C) CRS significantly reduced overall density of thin spines in both left (B) and right (C) PFC callosal neurons; this effect was more pronounced in left PFC neurons, particularly on distal ( > 150 μm) dendrites. (D and E) CRS decreased the overall density of mushroom-shaped spines in both hemispheres; significant CRS-induced loss of mushroom-shaped spine was localized to distal dendrites (>150 μm) of left PFC neurons (D) and to the proximal dendrites (<150 μm) of right PFC neurons (E). (F and G) CRS had no significant effect on the density of stubby spines of either left (F) or right (G) PFC neurons.
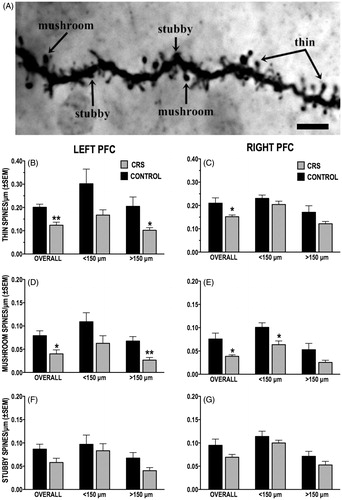
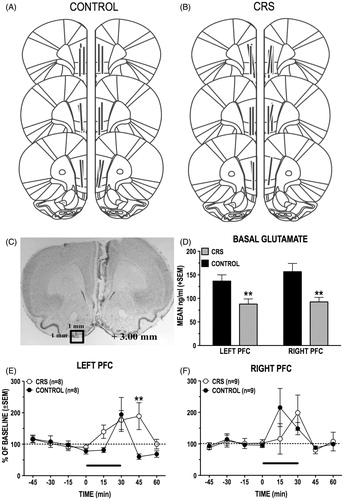
Figure 7. (A–F) Basal and stress-induced changes in dialysate levels of GLU in the left and right PFC of control and CRS animals. (A and B) Schematic reconstruction of microdialysis probe (vertical bars) placements within the right and the left PL/IL of control and CRS animals. Length of vertical bars corresponds to the length of the active portion of the microdialysis membrane (2.5 mm). (C) Photomicrograph depicting typical damage produced by PFC microdialysis probe. (D) Basal (prestress) levels of GLU in the left and the right PFC of control and CRS rats. CRS reduced basal GLU levels in both the left and the right PFC. (E and F) Comparison of stress-induced increases in dialysate GLU levels in the right (E) and the left (F) PFC of control and CRS rats. The length of the black bar corresponds to the duration of the tail-pinch (TP) stress episode (30 min). There was a hemispheric difference in the timing of the GLU stress response of unstressed control rats: TP stress elicited an increase in GLU transmission in the right PFC before it did in the left PFC. CRS eliminated this hemispheric difference. In the left PFC, CRS animals had a prolonged GLU stress response compared to controls. CRS did not significantly alter the GLU stress response in the right PFC. **p < 0.01 versus prestress baseline.