Figures & data
Figure 1. The HESI RISK21 Roadmap and Matrix.
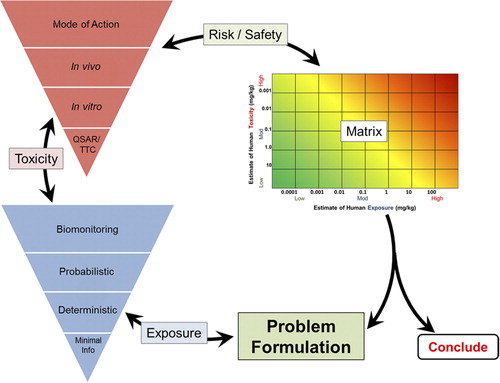
Figure 2. Quantitative Key Events/Dose-Response Framework (Q-KEDRF) and Its Relationship to the Mode of Action/Human Relevance Framework.
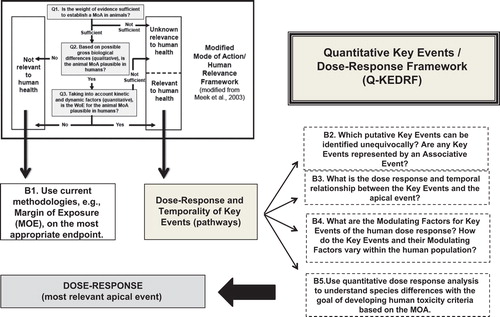
Table 1. Modulating Factors (ModFs) potentially affecting KEs for dose-response in humans. ModFs fall into three general categories shown in the left column. The middle column shows subcategories and the right hand column shows some aspects to consider.
Table 2. Dose-time concordance table for dimethylarsinic acid.
Table 3. Dose-Response Species Concordance Table for Key Events (KEs) in the MOA of dimethylarsinic acid (DMAV) (Adapted from CitationUSEPA, 2005c).
Figure 3. Use of MOA in the HESI RISK21 Matrix. Left: MOA for Tumor Induction by Dimethylarsinic Acid (DMAV; Cacodylic Acid) that includes cytotoxicity, regenerative proliferation, and hyperplasia. This MOA is used to illustrate the dose-time concordance table and dose-response species concordance table ( and ). Right: Matrix showing the exposure estimates and toxicity range (BMDL10 to RfD) for chronic dietary exposure, data from EPA, 2006.
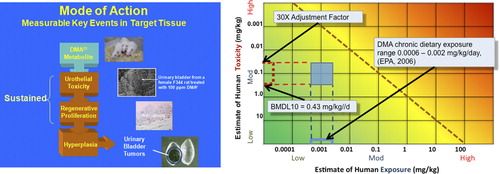
Figure 4. Mode of Action of Chlorpyrifos showing metabolic activation to CPF-oxon and inhibition of acetylcholinesterase as the critical effect. (Figure courtesy of Dr. Alan Boobis).

Figure 5. PON1-mediated Vmax values vs. age (upper plot). PON1 functional phenotypes are represented by open circles, open triangles, and open squares for QQ, QR, and RR, respectively (see text for definitions). CPF- oxon hydrolysis Vmax values in plasma over paraoxon hydrolysis activity (lower plot) resolves QQ and QR, but not QR and RR. (From CitationSmith et al. 2011; permission to reproduce figures granted by Dr. Jordan Smith, 22 March 2013.).
Figure 6. Modeled chlorpyrifos pharmacokinetics in adults and children and resulting AChE inhibition in erythrocytes. A. RBC AChE inhibition from the AUC (left) and maximum CPF concentrations (right) in blood (from CitationHinderliter et al. 2011). B. Modeled time courses of CPF and CPF oxon in blood from dietary exposures (upper panel) and corresponding RBC AChE inhibition (lower panel). (Reprinted from Regulatory Toxicology and Pharmacology (Hinderliter, P.M., Price P.S., Bartels M.J., Timchalk C., Poet T.S. 2011. Development of a source-to-outcome model for dietary exposures to insecticide residues: An example using chlorpyrifos, Regul. Toxicol. Pharmacol. 61, 82–92) with permission from Elsevier.).
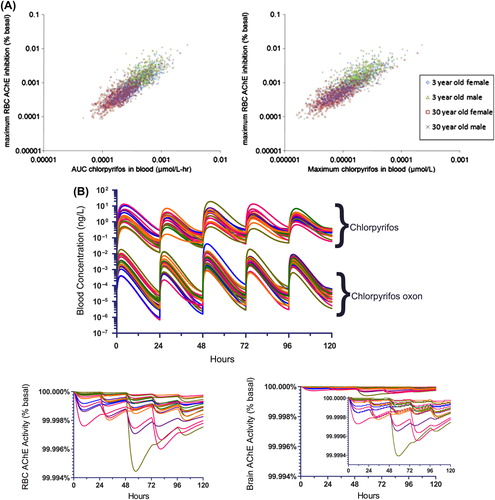
Table 4. Dose-response concordance table for Modulating Factors (MFs) in the MOA of chlorpyrifos.
Figure 7. Putative MOA for the uterotrophic response.
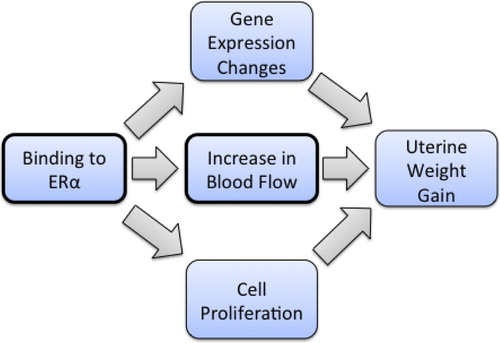
Table 5. Cellular effects of modulating factors.
Figure 8. Dose-response plots for putative key events in the MOA for the uterotrophic response.
Table 6. Quantitative aspects of the dose-response of key events in the uterotrophic response.
Table 7. Inverse equations and slope equations of dose-response models from EPA’s benchmark dose software (USEPA 2012) to enable estimation of baseline projection values.
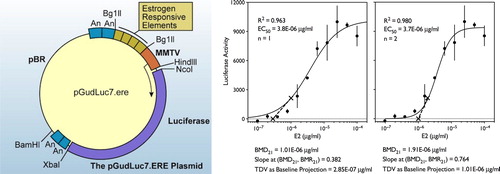
Figure 9. Details of one of the heterologous expression systems that could be used to substitute for the uterotrophic assay. Left: Stably transfected Luc reporter plasmid BG1Luc4E2 cell line from ICCVAM. Right: Concentration-response of the BG1Luc4E2 cells to estradiol showing fits to both first- and second-order Hill functions and the results of the transitional dose value calculation using the baseline projection method (Eq. 3,4 and 5). Please see Supplementary Content for another example.