642
Views
17
CrossRef citations to date
0
Altmetric
Research Article

In vitro and in vivo studies of lipid-based nanocarriers for oral N3-o-toluyl-fluorouracil delivery

, , , &
Pages 352-363 | Received 12 Dec 2009, Accepted 09 Mar 2010, Published online: 13 Apr 2010

Figures & data

Figure 1. Chemical structure of N3-o-toluyl-fluorouracil (TFu).

Figure 1.  Chemical structure of N3-o-toluyl-fluorouracil (TFu).

Table 1. Physicochemical characteristics of different TFu-loaded nanocarriers.

Figure 2. Mean TFu blood concentrations vs time profiles after oral administration of TFu suspension, cationic TFu-SLNs, anionic TFu-SLNs, and TFu-liposomes in mice, the data were presented as mean ± SD (n = 5 in each group).
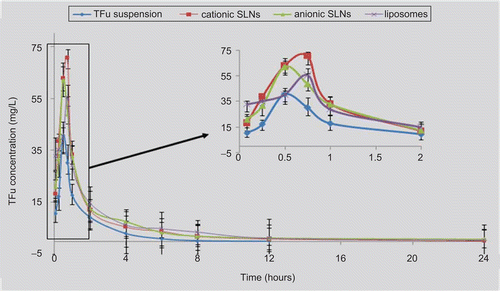
Figure 2.  Mean TFu blood concentrations vs time profiles after oral administration of TFu suspension, cationic TFu-SLNs, anionic TFu-SLNs, and TFu-liposomes in mice, the data were presented as mean ± SD (n = 5 in each group).

Figure 3. Cytotoxicity of TFu-loaded nanocarriers with different concentrations after 24 h of incubation with Caco-2 cells using the CCK-8 method (compared to the negative control). Each data was presented as mean ± SD (n = 6 in each group).
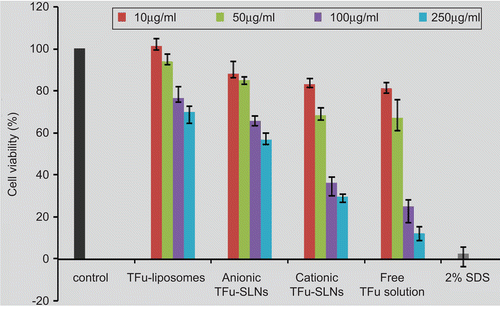
Figure 3.  Cytotoxicity of TFu-loaded nanocarriers with different concentrations after 24 h of incubation with Caco-2 cells using the CCK-8 method (compared to the negative control). Each data was presented as mean ± SD (n = 6 in each group).

Figure 4. TFu transport across Caco-2 cell monolayers from the apical to basolateral from different formulations, the data were presented as mean ± SD (n = 6 in each group).
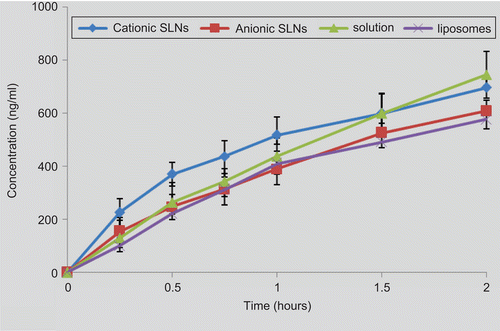
Figure 4.  TFu transport across Caco-2 cell monolayers from the apical to basolateral from different formulations, the data were presented as mean ± SD (n = 6 in each group).

Figure 5. Permeability (Papp) of TFu from free solution and three nonocarriers suspensions across the Caco-2 cell monolayers, the data were presented as mean ± SD (n = 6 in each group). * p < 0.05, ** p< 0.01 vs liposomes.
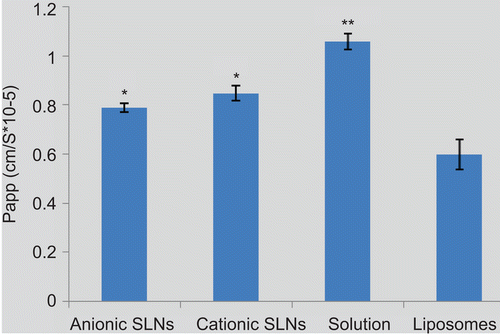
Figure 5.  Permeability (Papp) of TFu from free solution and three nonocarriers suspensions across the Caco-2 cell monolayers, the data were presented as mean ± SD (n = 6 in each group). * p < 0.05, ** p< 0.01 vs liposomes.

Table 2. The absorption parameters of different formulations following in situ single-pass rat intestinal perfusion after perfusing for 6 h.

Table 3. The permeability coefficient values (Peff, cm/s) following in situ single-pass rat intestinal perfusion to the different small intestinal regions.
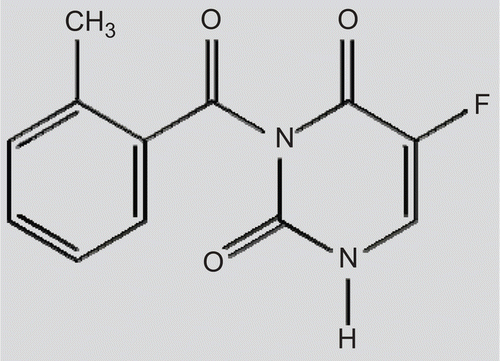
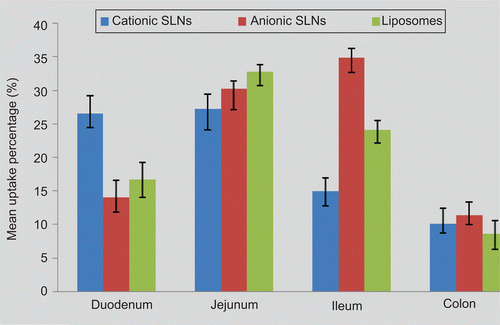
Figure 6. Absorption of drugs at various regions of the rat intestine, the data were presented as mean ± SD (n = 5 in each group). * p < 0.01 vs anionic SLNs and liposomes; ** p < 0.01 vs cationic SLNs and liposomes.

Figure 6.  Absorption of drugs at various regions of the rat intestine, the data were presented as mean ± SD (n = 5 in each group). * p < 0.01 vs anionic SLNs and liposomes; ** p < 0.01 vs cationic SLNs and liposomes.

Reprints and Corporate Permissions

Please note: Selecting permissions does not provide access to the full text of the article, please see our help page How do I view content?

To request a reprint or corporate permissions for this article, please click on the relevant link below:

Academic Permissions

Please note: Selecting permissions does not provide access to the full text of the article, please see our help page How do I view content?

Obtain permissions instantly via Rightslink by clicking on the button below:

If you are unable to obtain permissions via Rightslink, please complete and submit this Permissions form. For more information, please visit our Permissions help page.