Figures & data
Table 1. Blank formulations compatibility test (vehicle compositions for screening SEDDS formulations, with the proportion of oil 30%, surfactant 50%, cosurfactant 20%).
Table 2. Solubility of piperine in various vehicles at 25 °C (n = 3, mean ± SD; mg/ml).
Figure 1. Pseudo-ternary phase diagrams indicating the efficient self-emulsification region with ethyl oleate as oil, Tween 80 as surfactant, and Transcutol P as the cosurfactant, with a drug loading of 2.5%. The solid outline represents the area explored for nano-emulsion region; and the filled squares represent the compositions which were evaluated.
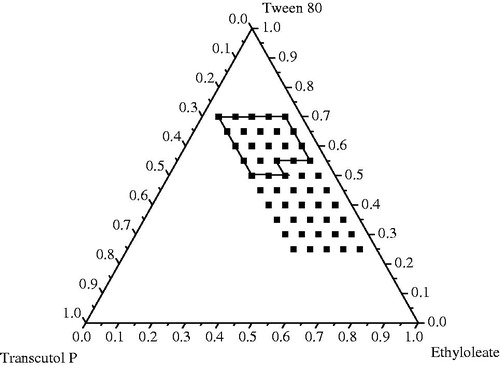
Figure 2. Size distribution of Piperine (Pip) SEDDS in water.
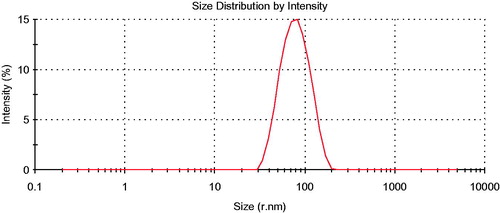
Figure 3. Dissolution profiles of Pip from SEDDS and self-prepared capsule (n = 6).
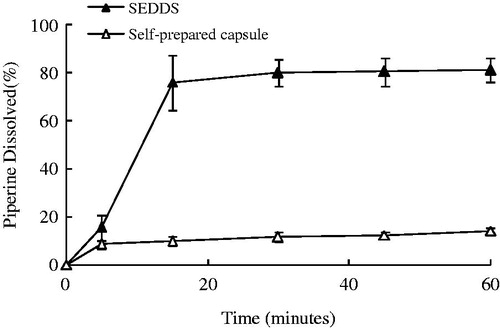
Figure 4. Plasma concentration-time profiles of Pip from SEDDS and self-prepared capsule following oral administrations in rats. Each value is mean ± SE (n = 6).
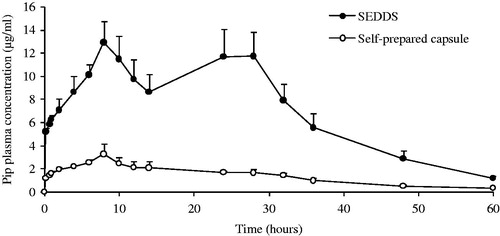
Table 3. Main pharmacokinetic parameters of piperine after a single oral dose of SEDDS or self-prepared capsules in rats (n = 6, mean ± SE, **p < 0.01; *p < 0.05).
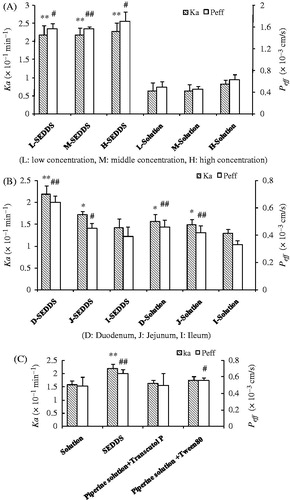
Figure 5. (A) Comparison of Peff and Ka of different concentration perfusion solutions determined by SPIP study in rat duodenum; (B) Effect of different intestine segments on compounds absorption; (C) Effect of adjuvant on absorption parameters of Pip solution. (n = 5, mean ± SD, #p < 0.05, ##p < 0.01 represented for Peff, *p < 0.05, **p < 0.01 represented for Ka).