Figures & data
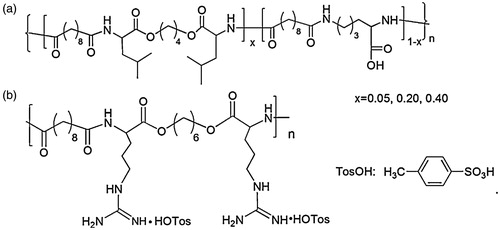
Figure 1. Three possible routes through the intestinal epithelium.
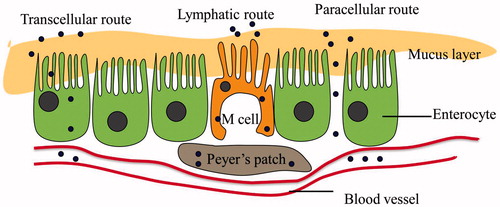
Table 1. Approaches to improve the bioavailability of insulin.
Figure 2. Schematic illustrations of the opening of chitosan-mediated reversible tight junction (TJ) (Sung et al., Citation2012).
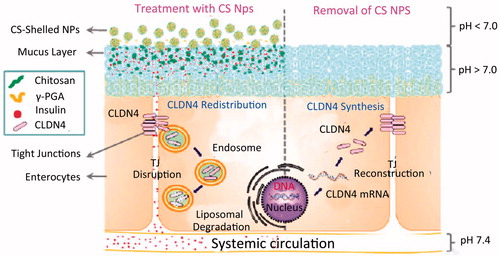
Figure 3. (a) Blood glucose level versus time profiles and (b) plasma insulin level versus time profiles of test diabetic rats following the administration of different insulin formulations (Sonaje et al., Citation2010a,Citationb,Citationc).
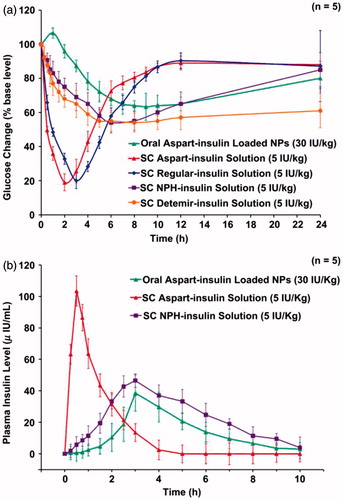
Figure 4. (a) Short model of PLGA. (b) Interaction of the insulin with a PLGA model of near 1500 Da. In this figure the histidine are shown in space filling, the glutamate in ball and stick (Lassalle & Ferreira, Citation2010).
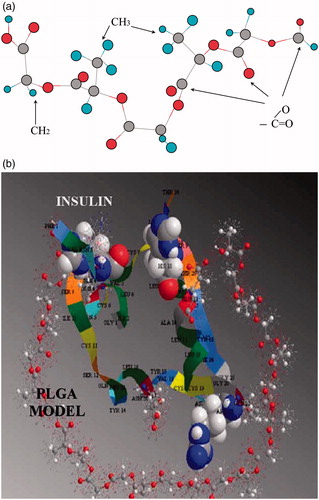
Figure 5 The synthesis scheme of PLA-P85-PLA block copolymer (Xiong et al., Citation2013).
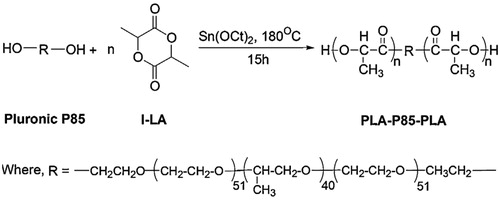
Figure 6. (a) TEM micrograph of PLA-P85-PLA nanoparticle vesicles in water. (b) The possible schematic microstructure of PLA-P85-PLA vesicles (Xiong et al., Citation2013).
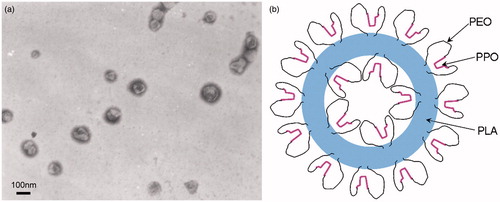
Figure 7. The blood glucose level versus time profiles following oral administration of physiological saline to control animals, insulin free PLA-P85-PLA vesicles, insulin-loaded PLA-P85-PLA vesicles (50, 100 and 200 IU/kg), and subcutaneous injection of free insulin (5 IU/kg). Results are means ± S.D. of five animals per group. Significant difference from negative physiological saline control (*p < 0.05; **p < 0.01) (Xiong et al., Citation2013).
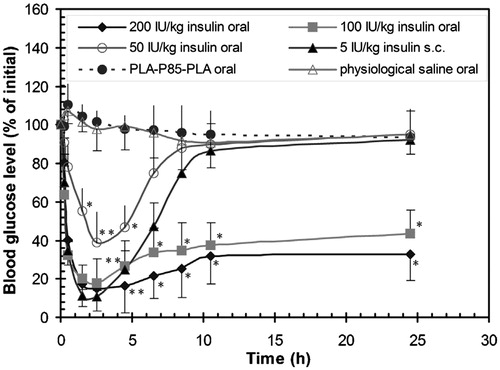
Figure 8 Chemical structures of the poly(ester amide)s. (a) l-Lysine/l-Leucine-based PEA-COOH. (b) Arginine-based Arg-PEA (He et al., Citation2013).