Figures & data
Figure 1. Concept of the 2D image overlay: a flat display and semi-transparent mirror are co-aligned with the CT scanner to produce an image to guide interventions.
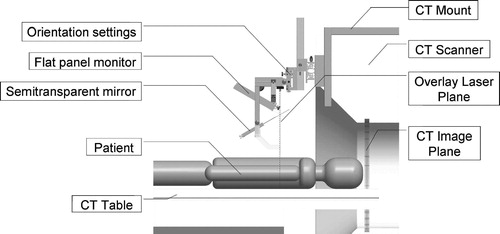
Figure 2. Physician's perspective: the overlay image in the mirror appears to be floating inside the subject while the physician manipulates the needle behind the mirror. (Phantom experiment on a honeydew melon.)
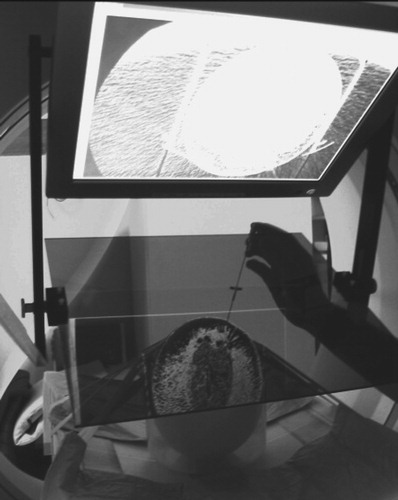
Figure 3. IZI biopsy strip fiducial as seen both on the subject and in the overlay image (abdominal phantom experiment).
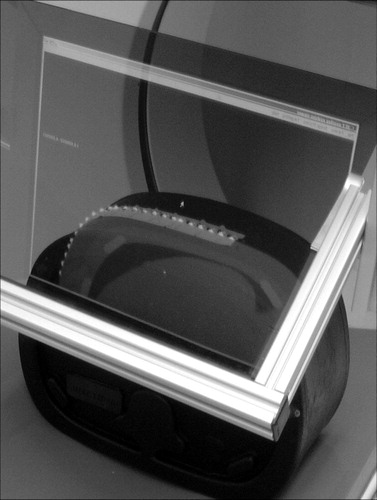
Figure 4. Image overlay system that creates the floating image in the scan plane of the CT gantry. (A close up of this experiment is shown in .)
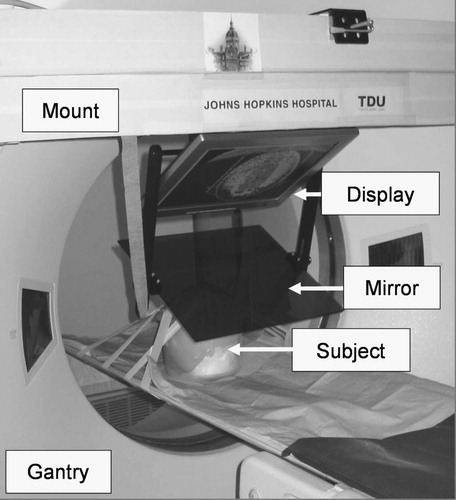
Figure 5. Image overlay system that renders the image in the outer transverse laser plane of the CT scanner. The patient is conveniently accessible for multiple physicians who share the same view.
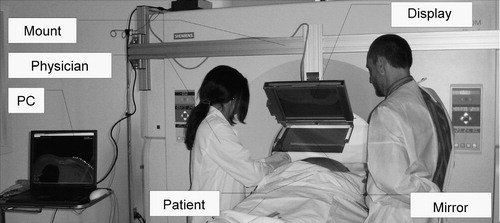
Figure 6. Image overlay system that shows the floating image in an arbitrary transverse plane. Decoupled knobs are used to rotate the display parallel to the scanner's imaging plane.
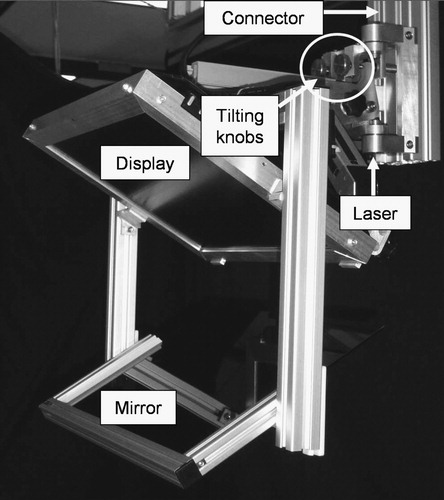
Figure 7. Calibration phantom made of perpendicular acrylic boards with aluminum pegs. After calibration, the overlaid CT slice of the phantom is in perfect overlap with the physical object.
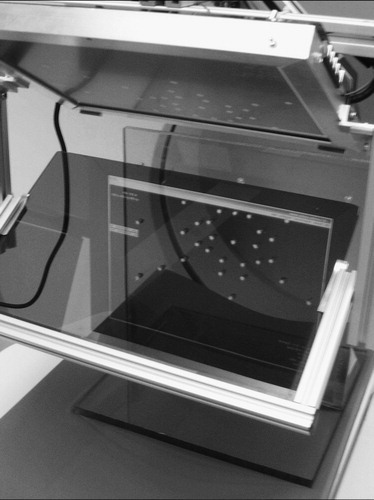
Figure 8. Stereotactic calibration adapter mounted on the image overlay device (left) and CT image of the adapter (right). The CT image shows sharp marks from the rods that can be conveniently segmented.
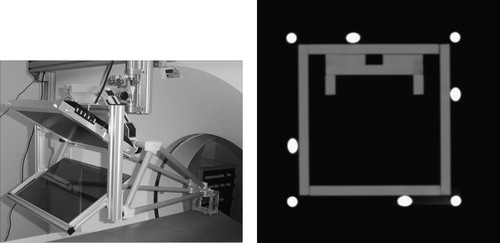
Figure 9. Frame transformations in stereotactic calibration. FSD and FAS are measured with the Optotrak tracker in the laboratory while FCA is determined inside the scanner.
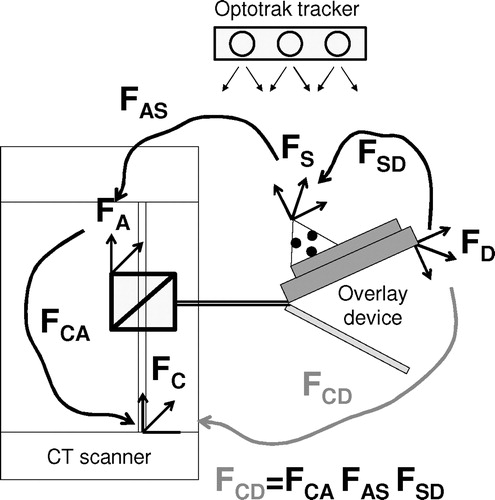
Figure 10. Target and confirmation image in phantom experiment with a honeydew melon. A 1.5-mm metal target was implanted in the melon (left), which was then subsequently hit by the 20 G needle (right).
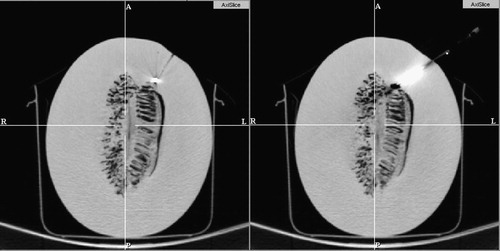
Figure 11. Phantom experiments on a male mannequin (left) and a tissue-equivalent commercial abdominal intervention phantom (right).
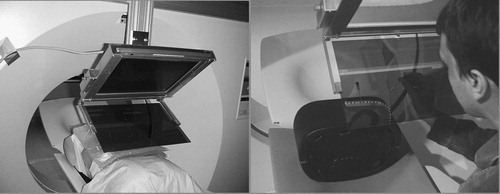
Figure 12. Target image (left) and confirmation CT image (right) in a hip arthrography.
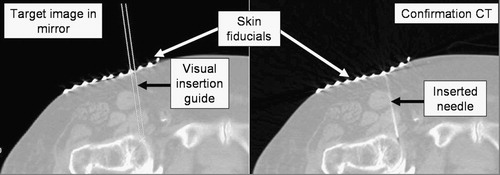
Figure 13. Liver insertion in a human cadaver (left) and confirmation CT image (right).
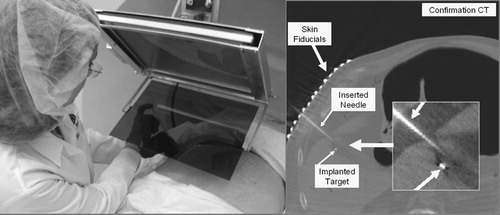
Figure 14. Needle insertion in the liver of a ventilated pig cadaver with straight gantry (left) and a confirmation CT image (right).
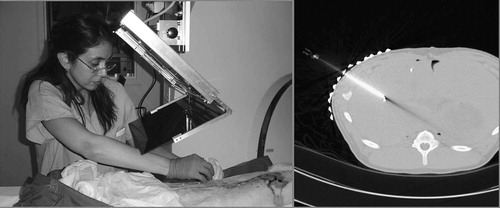
Figure 15. Needle insertion in the liver of a ventilated pig cadaver with tilted gantry (left) and a confirmation CT image (right).
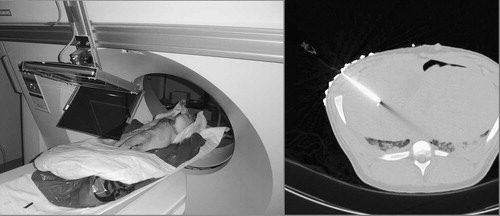
Table 1. Summary statistics for liver access in ventilated pigs. The total number of experiments performed was 22. The table does not differentiate between cases done with straight and tilted gantries.
Table 2. Results of liver access in ventilated pigs. The table does not differentiate between cases done with straight and tilted gantries.