Figures & data
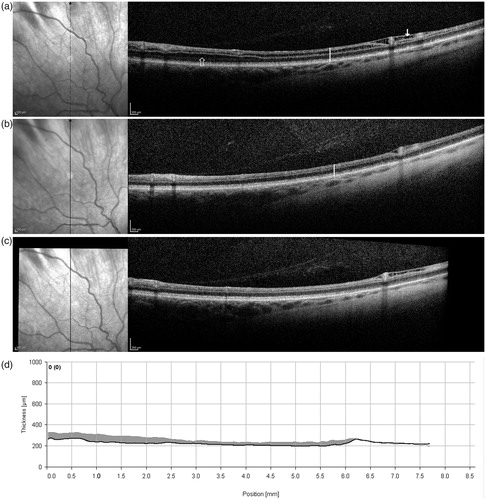
FIGURE 1. Right eye vertical SD-OCT line scans of the superior retina (about 10° to 40° from foveal center) at baseline, prior to treatment (a), and after 3 months (b) and 6 months (c) of treatment on topical dorzolamide 2% TID OU. At baseline (a), note splitting of the retina in the outer nuclear layer (open arrow), inner nuclear layer (vertical white line), and retinal nerve fiber layer (closed arrow). At follow-up the splitting is markedly reduced in both the outer and inner nuclear layers, while splitting of the retinal nerve fiber layer remained. No change from baseline to follow-up is seen in the outer segment ellipsoid layer, retinal pigment epithelial layer or posterior vitreous. The retinal thickness (from internal limiting membrane to Bruch’s membrane) at the location marked by the vertical white line in the SD-OCT images is 233 microns at baseline (a) and 207 microns at follow-up (b). The OCT line scan in (c) is aligned with a baseline OCT line scan, and the thickness profile difference is shown in (d) as the shaded gray area.