Figures & data
Scheme 1. Synthesis of 6H-indolo[2,3-b]quinoxaline derivatives. A: Conc. HCl, sodium sulfate, hydroxylamine HCl, reflux for 15 min; B: PPA/H2SO4, 56°C for 6 h/120°C for 6 h; C, D: o-phenylenediamine or diaminobenzoic acid, acetic acid/HCOOH, reflux for 1–7 h; E: CDI, dry DMF, stir at room temperature for 4 h, DCM, MgSO4; F: dry DMF, 120°C, 30 min–2 h; G: K2CO3, dry DMF, 85–100°C for 12–16 h.
![Scheme 1. Synthesis of 6H-indolo[2,3-b]quinoxaline derivatives. A: Conc. HCl, sodium sulfate, hydroxylamine HCl, reflux for 15 min; B: PPA/H2SO4, 56°C for 6 h/120°C for 6 h; C, D: o-phenylenediamine or diaminobenzoic acid, acetic acid/HCOOH, reflux for 1–7 h; E: CDI, dry DMF, stir at room temperature for 4 h, DCM, MgSO4; F: dry DMF, 120°C, 30 min–2 h; G: K2CO3, dry DMF, 85–100°C for 12–16 h.](/cms/asset/ee5e66ec-f8de-426f-a114-bb7c64b20c50/ienz_a_419247_f0001_b.gif)
Table 1. Structural variations and cytotoxicity of 6H-indolo[2,3-b]quinoxaline derivatives.
Table 2. Molecular descriptors used for modeling cytotoxicity of 6H-indolo[2,3-b]quinoxaline derivatives.
Table 3. Physicochemical characteristic of 6H-indolo[2,3-b]quinoxaline derivatives.
Table 4. Lipinski parameters of the compounds.
Figure 1. Position of the metabolites of 6H-indolo[2,3-b]quinoxaline derivatives (A), cisplatin (B), and 5-fluorouracil (C).
![Figure 1. Position of the metabolites of 6H-indolo[2,3-b]quinoxaline derivatives (A), cisplatin (B), and 5-fluorouracil (C).](/cms/asset/db384725-1cee-413b-a10f-d094d691553f/ienz_a_419247_f0002_b.gif)
Table 5. Correlation matrix for descriptors in QSAR models of series I.
Table 6. Variance inflation factor (VIF) and t-values of descriptors in the QSAR models derived for series I.
Table 7. Experimental and predicted activity values of 6H-indolo [2,3-b]quinoxaline derivatives.
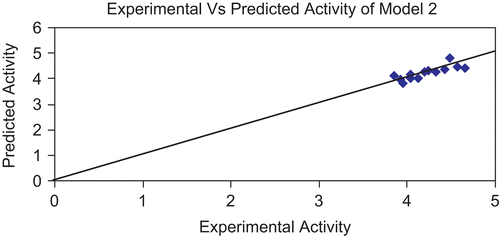
Figure 2. Graph showing correlation between experimental activity and predicted activity of model 1.

Figure 3. Graph showing correlation between experimental activity and calculated activity of model 1.


