825
Views
9
CrossRef citations to date
0
Altmetric
Research Article

Synthesis, Physico-Chemical investigations of Co(II), Ni(II) and Cu(II) complexes and their in vitro microbial, cytotoxic, DNA cleavage studies

&
Pages 430-439 | Received 16 Mar 2009, Accepted 03 Aug 2009, Published online: 07 Apr 2010

Figures & data

Scheme 1. Synthesized metal complexes.

Scheme 1.  Synthesized metal complexes.

Table 1. Elemental analysis of Schiff base and its Co(II), Ni(II), and Cu(II) complexes with magnetic and molar conductance data.

Table 2. Important infrared frequencies (in cm−1) of Schiff base and its Co(II), Ni(II), and Cu(II) complexes.

Table 3. Ligand field parameters of Co(II) and Ni(II) complexes.

Figure 1. FAB-mass spectrum of Schiff base.

Figure 1.  FAB-mass spectrum of Schiff base.

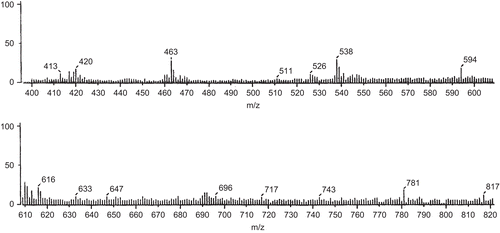
Figure 2. FAB-mass spectrum of Co(II) complex.

Figure 2.  FAB-mass spectrum of Co(II) complex.

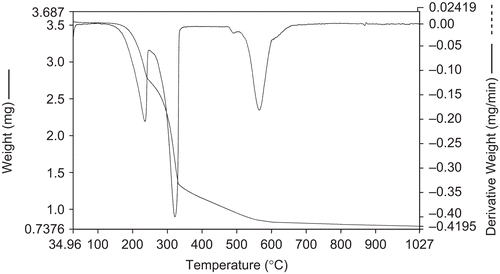
Figure 3. Thermogravimetric (TGA/DTG) curves of Cu(II) complex.

Figure 3.  Thermogravimetric (TGA/DTG) curves of Cu(II) complex.

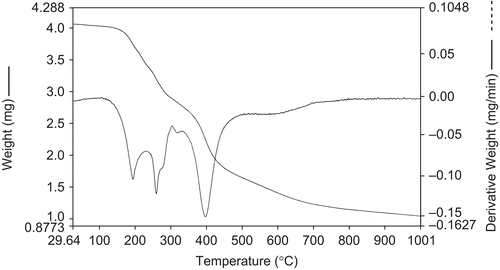
Figure 4. Thermogravimetric (TGA/DTG) curves of Ni(II) complex.

Figure 4.  Thermogravimetric (TGA/DTG) curves of Ni(II) complex.

Table 4. Thermogravimetric data of Co(II), Ni(II), and Cu(II) complexes.

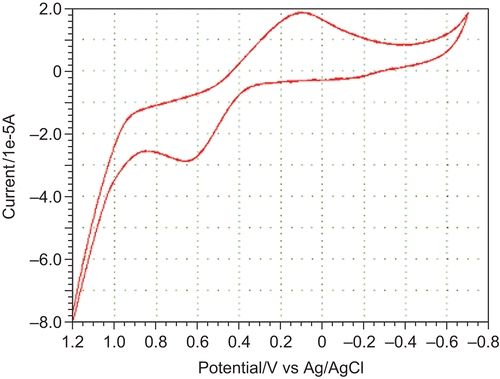
Figure 5. Cyclic voltammogram of Cu(II) complex.

Figure 5.  Cyclic voltammogram of Cu(II) complex.

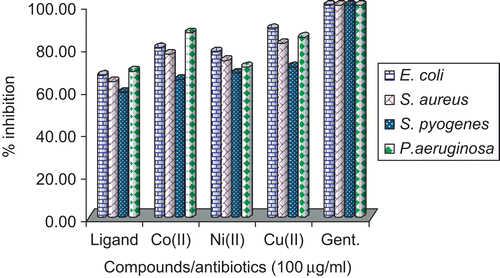
Table 5. Antibacterial results for Schiff base and its Co(II), Ni(II), and Cu(II) complexes.

Figure 6. Antibacterial study of Schiff base and its Co(II), Ni(II), and Cu(II) complexes.

Figure 6.  Antibacterial study of Schiff base and its Co(II), Ni(II), and Cu(II) complexes.

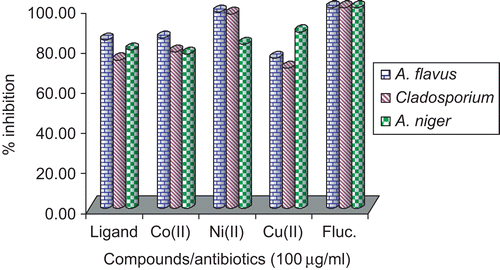
Figure 7. Antifungal study of Schiff base and its Co(II), Ni(II), and Cu(II) complexes.

Figure 7.  Antifungal study of Schiff base and its Co(II), Ni(II), and Cu(II) complexes.

Table 6. Minimum inhibitory concentration (MIC, μg/mL) results for Schiff base and its Co(II), Ni(II), and Cu(II) complexes.

Table 7. Brine shrimp bioassay data for Schiff base and its Co(II), Ni(II), and Cu(II) complexes.

Figure 8. Agarose gel electrophoresis. M, standard molecular weight marker; C-E.coli, control DNA of E. coli; lanes 1–4, E. coli DNA treated with Schiff base, Cu(II), Co(II), and Ni(II) complexes, respectively; lanes 5–8, A. niger DNA treated with Schiff base, Cu(II), Co(II), and Ni(II) complexes, respectively; C-niger, control DNA of A. niger.
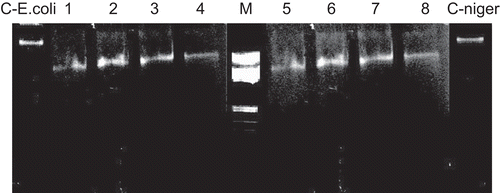
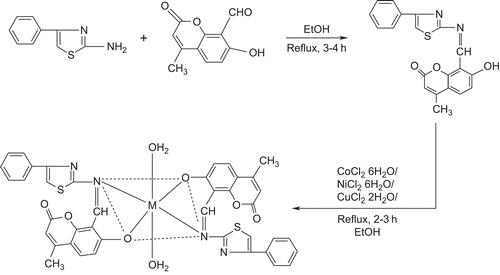
Figure 8.  Agarose gel electrophoresis. M, standard molecular weight marker; C-E.coli, control DNA of E. coli; lanes 1–4, E. coli DNA treated with Schiff base, Cu(II), Co(II), and Ni(II) complexes, respectively; lanes 5–8, A. niger DNA treated with Schiff base, Cu(II), Co(II), and Ni(II) complexes, respectively; C-niger, control DNA of A. niger.
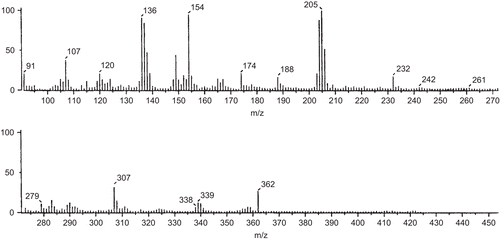
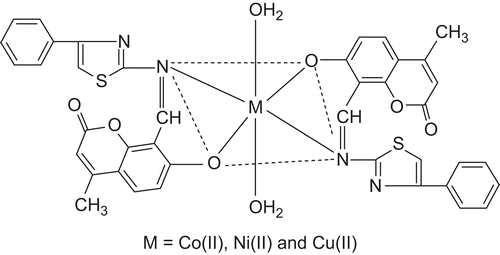
Figure 9. Octahedral structure of metal(II) complexes.

Figure 9.  Octahedral structure of metal(II) complexes.

Reprints and Corporate Permissions

Please note: Selecting permissions does not provide access to the full text of the article, please see our help page How do I view content?

To request a reprint or corporate permissions for this article, please click on the relevant link below:

Academic Permissions

Please note: Selecting permissions does not provide access to the full text of the article, please see our help page How do I view content?

Obtain permissions instantly via Rightslink by clicking on the button below:

If you are unable to obtain permissions via Rightslink, please complete and submit this Permissions form. For more information, please visit our Permissions help page.