Figures & data
Figure 2. Progress curves for the slow-binding inhibition of HLE by 4-oxo-β-lactam 3. Reaction conditions: [HLE] = 20 nM, [MeOSuc-Ala-Ala-Pro-Val-p-NA] = 1 mM, 0.1 M HEPES buffer, pH 7.2, 25 °C. [Citation3]: (a) 0; (b) 6.25; (c) 12.5; (d) 25; (e) 50; (f) 100 nM.
![Figure 2. Progress curves for the slow-binding inhibition of HLE by 4-oxo-β-lactam 3. Reaction conditions: [HLE] = 20 nM, [MeOSuc-Ala-Ala-Pro-Val-p-NA] = 1 mM, 0.1 M HEPES buffer, pH 7.2, 25 °C. [Citation3]: (a) 0; (b) 6.25; (c) 12.5; (d) 25; (e) 50; (f) 100 nM.](/cms/asset/2a2d75cb-e09a-41cf-999f-a5e9a214997e/ienz_a_486794_f0003_b.gif)
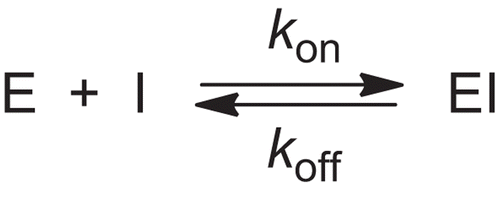
Scheme 2. Kinetic model for acyl-enzyme inhibition of HLE by 4-oxo-β-lactam 3 in the presence of substrate.

Table 1. Summary of enzyme inhibition at 25°C and stability kinetic data at 37°C, for 4-oxo-β-lactam 3.
Figure 3. A) Effect of inhibitor concentration on the onset of inhibition of HLE by 4-oxo-β-lactam 3. The values of kobs were obtained as an average of at least duplicate assays from fits to Equation 1 of the data shown in ; B) Plot of the steady-state rates, vs, versus [Citation3] for the inhibition of HLE. The data were obtained from fits of the curves shown in . The solid line was drawn using the best-fit parameters from a fit according to Equation 5.
![Figure 3. A) Effect of inhibitor concentration on the onset of inhibition of HLE by 4-oxo-β-lactam 3. The values of kobs were obtained as an average of at least duplicate assays from fits to Equation 1 of the data shown in Figure 2; B) Plot of the steady-state rates, vs, versus [Citation3] for the inhibition of HLE. The data were obtained from fits of the curves shown in Figure 2. The solid line was drawn using the best-fit parameters from a fit according to Equation 5.](/cms/asset/a44843a2-7c93-4378-adc7-4cd7148ea252/ienz_a_486794_f0005_b.gif)
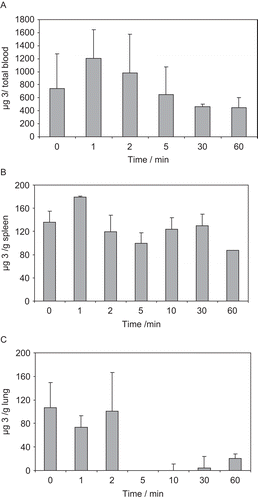
Figure 4. Mean ± sd pharmacokinetic profile in A) total mice blood, B) mice spleen and C) mice lung, after administration of a ip 30 mg/kg dosage of 4-oxo-β-lactam 3.


