462
Views
7
CrossRef citations to date
0
Altmetric
Original Article

Molecular modelling studies on d-annulated benzazepinones as VEGF-R2 kinase inhibitors using docking and 3D-QSAR

, , , &
Pages 367-377 | Received 19 May 2010, Accepted 02 Aug 2010, Published online: 17 Sep 2010

Figures & data

Figure 1.  Basic structure of paullones and d-annulated benzazepinones.

Figure 1.  Basic structure of paullones and d-annulated benzazepinones.

Table 1.  The structures of the training and test set molecules.

Table 2.  The actual pIC50s, predicted pIC50s (Pred.) and their residuals (Res.) of the training and test set molecules.

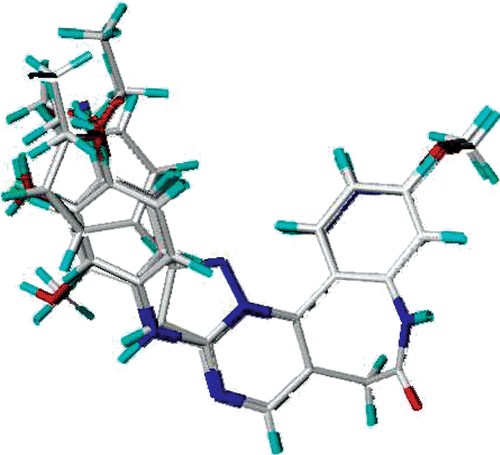
Figure 2.  Alignment of the compounds used in the training set.

Figure 2.  Alignment of the compounds used in the training set.

Figure 3.  Molecular Computer Aided Design (MOLCAD) Robbin surface of the adenosine triphosphate-binding site of VEGF-R2 (PDB code: 1Y6A) within compound 29. Key residues and hydrogen bonds were labelled. The α-helices were shown as helices or cylinders, while β-sheets were shown as arrows and the loop regions as tubes.
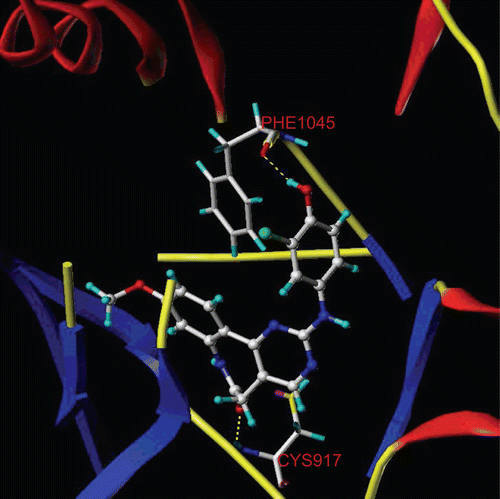
Figure 3.  Molecular Computer Aided Design (MOLCAD) Robbin surface of the adenosine triphosphate-binding site of VEGF-R2 (PDB code: 1Y6A) within compound 29. Key residues and hydrogen bonds were labelled. The α-helices were shown as helices or cylinders, while β-sheets were shown as arrows and the loop regions as tubes.

Figure 4.  The Molecular Computer Aided Design (MOLCAD) Robbin and multi-channel surfaces structure displayed with cavity depth (CD) potential of the adenosine triphosphate pocket of VEGF-R2 (PDB code: 1Y6A) within compound 29. The cavity depth colour ramp ranges from blue (low depth values = outside of the pocket) to light red (high depth values = cavities deep inside the pocket).
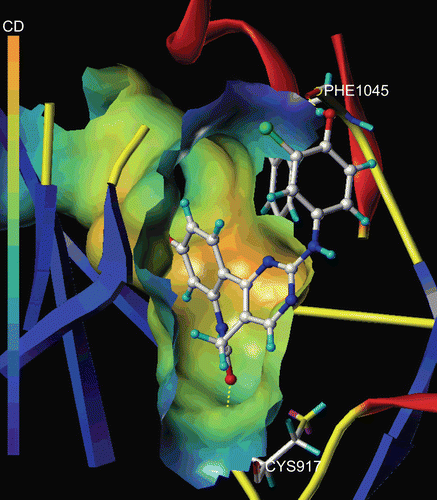
Figure 4.  The Molecular Computer Aided Design (MOLCAD) Robbin and multi-channel surfaces structure displayed with cavity depth (CD) potential of the adenosine triphosphate pocket of VEGF-R2 (PDB code: 1Y6A) within compound 29. The cavity depth colour ramp ranges from blue (low depth values = outside of the pocket) to light red (high depth values = cavities deep inside the pocket).

Table 3.  Results of CoMFA and CoMSIA models.

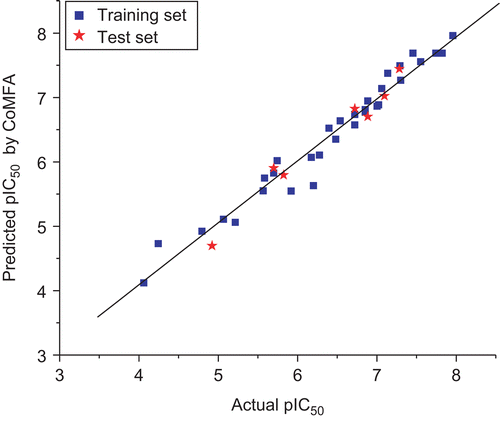
Figure 5.  Graph of actual versus predicted pIC50 of the training set and the test set using CoMFA.

Figure 5.  Graph of actual versus predicted pIC50 of the training set and the test set using CoMFA.

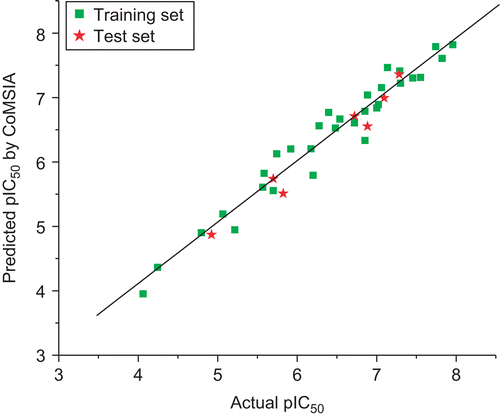
Figure 6.  Graph of actual versus predicted pIC50 of the training set and the test set using CoMSIA.

Figure 6.  Graph of actual versus predicted pIC50 of the training set and the test set using CoMSIA.

Figure 7.  Standard coefficient contour maps of CoMFA analysis with 2 Å grid spacing in combination with compound 29. (A) Steric fields: green contours (80% contribution) indicate regions where bulky groups increase activity, while yellow contours (20% contribution) indicate regions where bulky groups decrease activity, and (B) electrostatic fields: blue contours (80% contribution) indicate regions where electron-donating groups increase activity, while red contours (20% contribution) indicate regions where electron-withdrawing groups increase activity.
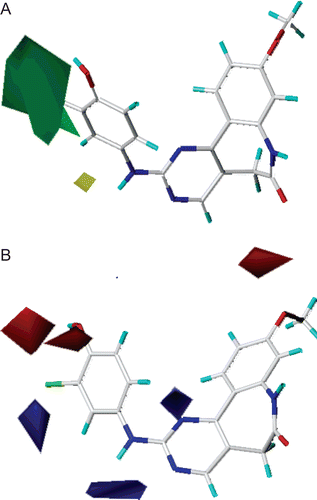
Figure 7.  Standard coefficient contour maps of CoMFA analysis with 2 Å grid spacing in combination with compound 29. (A) Steric fields: green contours (80% contribution) indicate regions where bulky groups increase activity, while yellow contours (20% contribution) indicate regions where bulky groups decrease activity, and (B) electrostatic fields: blue contours (80% contribution) indicate regions where electron-donating groups increase activity, while red contours (20% contribution) indicate regions where electron-withdrawing groups increase activity.

Figure 8.  Standard coefficient contour maps of CoMSIA analysis with 2 Å grid spacing in combination with compound 29. (A) Steric contour map. Green and yellow contours refer to sterically favoured and unfavoured regions. (B) Electrostatic contour map. Blue and red contours refer to regions where electron-donating and electron-withdrawing groups are favoured. (C) Hydrophobic contour map. White and yellow contours refer to regions where hydrophilic and hydrophobic substituents are favoured. (D) Hydrogen bond donor and acceptor contour map. The cyan and purple contours indicate favourable and unfavourable hydrogen bond donor groups. The magenta and red contours demonstrated favourable and unfavourable hydrogen bond acceptor groups.
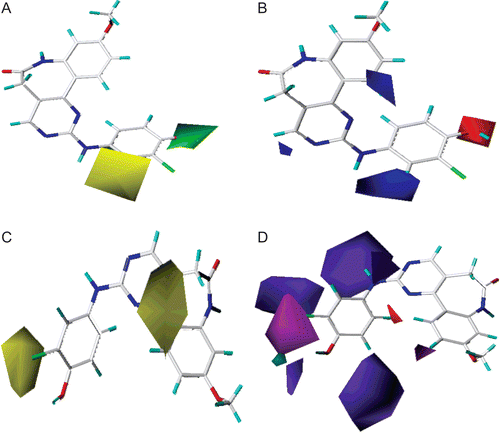
Figure 8.  Standard coefficient contour maps of CoMSIA analysis with 2 Å grid spacing in combination with compound 29. (A) Steric contour map. Green and yellow contours refer to sterically favoured and unfavoured regions. (B) Electrostatic contour map. Blue and red contours refer to regions where electron-donating and electron-withdrawing groups are favoured. (C) Hydrophobic contour map. White and yellow contours refer to regions where hydrophilic and hydrophobic substituents are favoured. (D) Hydrogen bond donor and acceptor contour map. The cyan and purple contours indicate favourable and unfavourable hydrogen bond donor groups. The magenta and red contours demonstrated favourable and unfavourable hydrogen bond acceptor groups.

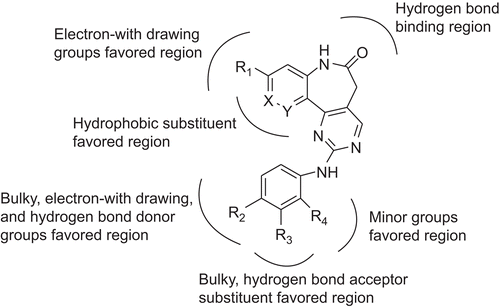
Figure 9.  Structure-activity relationship revealed by 3D-QSAR and docking studies.

Figure 9.  Structure-activity relationship revealed by 3D-QSAR and docking studies.

Table 4.  Chemical structures of newly designed inhibitors and their predicted pIC50 values.
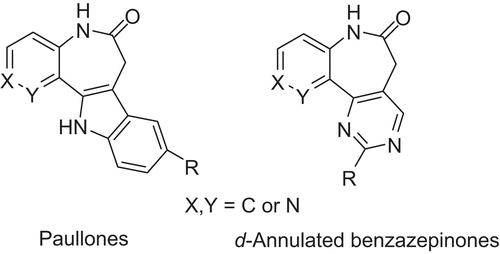
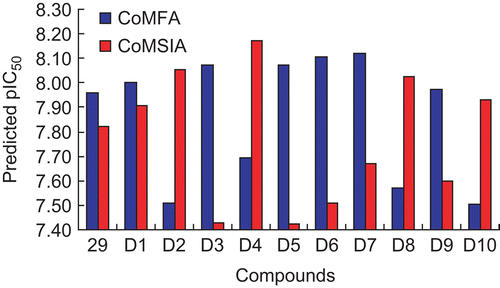
Figure 10.  Graph of the predicted pIC50 of designed inhibitors versus compound 29 using CoMFA and CoMSIA.

Figure 10.  Graph of the predicted pIC50 of designed inhibitors versus compound 29 using CoMFA and CoMSIA.

Reprints and Corporate Permissions

Please note: Selecting permissions does not provide access to the full text of the article, please see our help page How do I view content?

To request a reprint or corporate permissions for this article, please click on the relevant link below:

Academic Permissions

Please note: Selecting permissions does not provide access to the full text of the article, please see our help page How do I view content?

Obtain permissions instantly via Rightslink by clicking on the button below:

If you are unable to obtain permissions via Rightslink, please complete and submit this Permissions form. For more information, please visit our Permissions help page.