3,332
Views
30
CrossRef citations to date
0
Altmetric
Original Article

The inhibition study of human UDP-glucuronosyltransferases with cytochrome P450 selective substrates and inhibitors

, , &
Pages 386-393 | Received 31 May 2010, Accepted 17 Aug 2010, Published online: 13 Oct 2010

Figures & data

Figure 1.  The structures of the 20 chemicals studied as the inhibitors of human UGTs.

Figure 1.  The structures of the 20 chemicals studied as the inhibitors of human UGTs.

Table 1.  Km and Vmax values for five expressed human UGTs*

Figure 2.  The enzyme kinetics of expressed human UGT1A1, 2B7, 1A4, and 1A6. UGT1A1-mediated β-estradiol-3-glucuronidation (A), UGT2B7-mediated diclofenac-glucuronidation (B), UGT1A4-mediated midazolam-N-glucuronidation (C), and UGT1A6-mediated 1-naphthol-glucuronidation (D) were fitted with Michaelis–Menten model and Eadie–Hofstee plots, respectively.
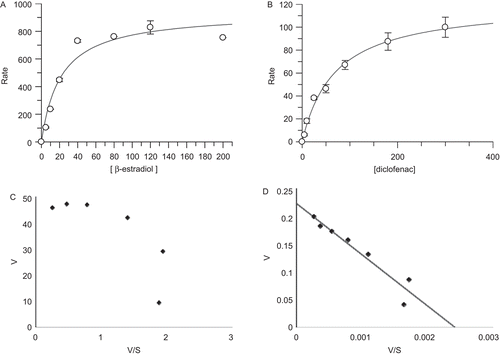
Figure 2.  The enzyme kinetics of expressed human UGT1A1, 2B7, 1A4, and 1A6. UGT1A1-mediated β-estradiol-3-glucuronidation (A), UGT2B7-mediated diclofenac-glucuronidation (B), UGT1A4-mediated midazolam-N-glucuronidation (C), and UGT1A6-mediated 1-naphthol-glucuronidation (D) were fitted with Michaelis–Menten model and Eadie–Hofstee plots, respectively.

Table 2.  Determination of the IC50 values*.

Figure 3.  The inhibition plots of expressed human UGT1A4-mediated midazolam-N-glucuronidation by α-naphthoflavone (A), and paclitaxel (B); UGT1A6-mediated 1-naphthol-glucuronidation by midazolam (C); UGT1A4-mediated midazolam-N-glucuronidation by cyclosporine A (D); UGT1A1-mediated β-estradiol-3-glucuronidation by ketoconazole (E). Their inhibition IC50 values were calculated to be 23 ± 6, 4.9 ± 0.3, 23 ± 1, 23 ± 7, and 4.1 ± 0.8 µM, respectively.
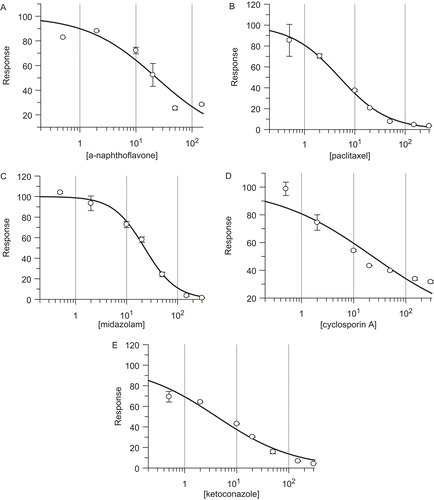
Figure 3.  The inhibition plots of expressed human UGT1A4-mediated midazolam-N-glucuronidation by α-naphthoflavone (A), and paclitaxel (B); UGT1A6-mediated 1-naphthol-glucuronidation by midazolam (C); UGT1A4-mediated midazolam-N-glucuronidation by cyclosporine A (D); UGT1A1-mediated β-estradiol-3-glucuronidation by ketoconazole (E). Their inhibition IC50 values were calculated to be 23 ± 6, 4.9 ± 0.3, 23 ± 1, 23 ± 7, and 4.1 ± 0.8 µM, respectively.

Figure 4.  Eadie–Hofstee plots for inhibitions kinetics of expressed human UGT1A1-mediated β-estradiol-3-glucuronidation by paclitaxel (A), ketoconazole (B), and midazolam (C). The concentrations of inhibitors were as shown in the figures, and the substrate concentrations were set at 5, 10, 20, and 40 µM for β-estradiol.
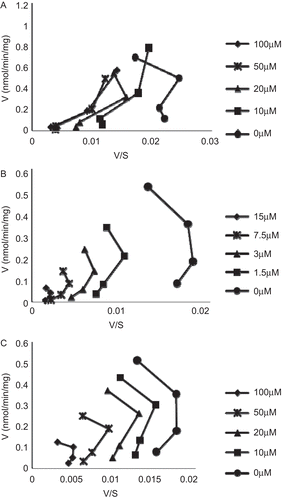
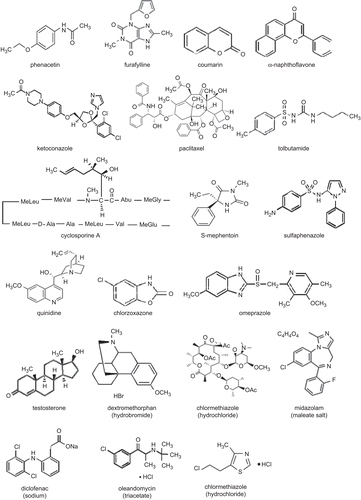
Figure 4.  Eadie–Hofstee plots for inhibitions kinetics of expressed human UGT1A1-mediated β-estradiol-3-glucuronidation by paclitaxel (A), ketoconazole (B), and midazolam (C). The concentrations of inhibitors were as shown in the figures, and the substrate concentrations were set at 5, 10, 20, and 40 µM for β-estradiol.

Reprints and Corporate Permissions

Please note: Selecting permissions does not provide access to the full text of the article, please see our help page How do I view content?

To request a reprint or corporate permissions for this article, please click on the relevant link below:

Academic Permissions

Please note: Selecting permissions does not provide access to the full text of the article, please see our help page How do I view content?

Obtain permissions instantly via Rightslink by clicking on the button below:

If you are unable to obtain permissions via Rightslink, please complete and submit this Permissions form. For more information, please visit our Permissions help page.