2,880
Views
26
CrossRef citations to date
0
Altmetric
Research Article

Evaluation of the inhibition of mushroom tyrosinase and cellular tyrosinase activities of oxyresveratrol: comparison with mulberroside A

, , , &
Pages 495-503 | Received 19 Mar 2011, Accepted 16 Jun 2011, Published online: 10 Aug 2011

Figures & data

Figure 1.  Inhibition of mushroom tyrosinase by oxyresveratrol (A) and mulberroside A, arbutin, and resveratrol (B). The tyrosinase DOPA oxidase activity of the untreated sample was taken as 100%; data are shown as percentage relative activity. Results are expressed as mean ± SD (n = 3). A p-value < 0.05 was considered the threshold for statistical significance.
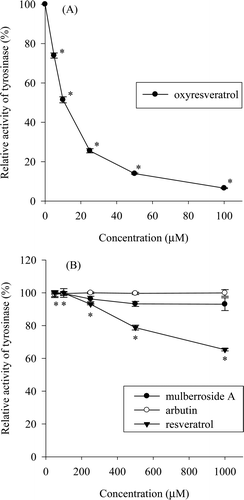
Figure 1.  Inhibition of mushroom tyrosinase by oxyresveratrol (A) and mulberroside A, arbutin, and resveratrol (B). The tyrosinase DOPA oxidase activity of the untreated sample was taken as 100%; data are shown as percentage relative activity. Results are expressed as mean ± SD (n = 3). A p-value < 0.05 was considered the threshold for statistical significance.
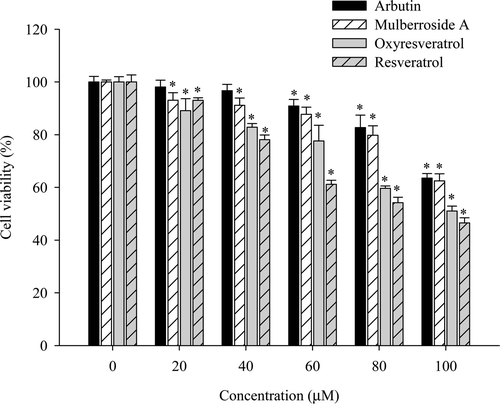
Table 1.  Inhibition of melanin synthesis in Streptomyces bikiniensis by compound of interest.

Figure 2.  Effect of oxyresveratrol, mulberroside A, resveratrol, and arbutin on B16F10 melanoma cell viability, as assayed by MTT. The data were normalized by setting 100% equal to the viability of the untreated control group. The results are presented as mean ± SD (n = 3). A p-value < 0.05 was considered the threshold for statistical significance.

Figure 2.  Effect of oxyresveratrol, mulberroside A, resveratrol, and arbutin on B16F10 melanoma cell viability, as assayed by MTT. The data were normalized by setting 100% equal to the viability of the untreated control group. The results are presented as mean ± SD (n = 3). A p-value < 0.05 was considered the threshold for statistical significance.

Figure 3.  Effect of oxyresveratrol and mulberroside A on cellular tyrosinase inhibition in B16F10 melanoma cells. Results are depicted relative to the control (100 nM α-MSH treatment only) and expressed as mean ± SD (n = 3). Means with the different letters are significantly different (p < 0.05).
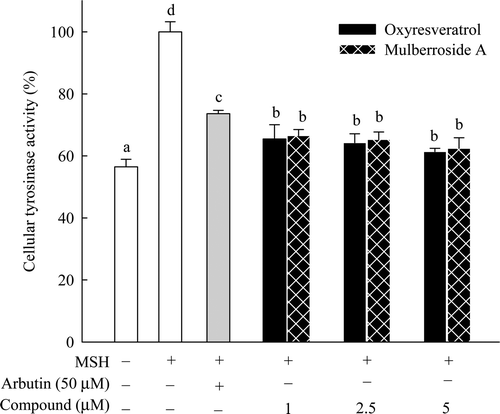
Figure 3.  Effect of oxyresveratrol and mulberroside A on cellular tyrosinase inhibition in B16F10 melanoma cells. Results are depicted relative to the control (100 nM α-MSH treatment only) and expressed as mean ± SD (n = 3). Means with the different letters are significantly different (p < 0.05).

Figure 4.  Inhibitory effect of oxyresveratrol and mulberroside A on melanogenesis in B16F10 melanoma cells exposed to 100 nM MSH. Cell pellets and culture broth after 2 days of incubation (A) and cellular melanin content (B) are shown; OXY and MUL are abbreviations of oxyresveratrol and mulberroside A, respectively. Results are expressed in µg/mg protein, mean ± SD (n = 3). Means with the different letters are significantly different (p < 0.05).
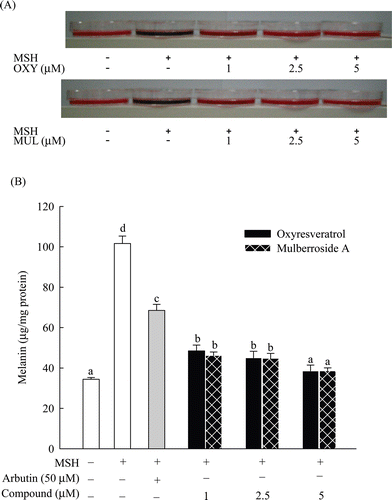
Figure 4.  Inhibitory effect of oxyresveratrol and mulberroside A on melanogenesis in B16F10 melanoma cells exposed to 100 nM MSH. Cell pellets and culture broth after 2 days of incubation (A) and cellular melanin content (B) are shown; OXY and MUL are abbreviations of oxyresveratrol and mulberroside A, respectively. Results are expressed in µg/mg protein, mean ± SD (n = 3). Means with the different letters are significantly different (p < 0.05).

Figure 5.  Western blotting (A) and quantitative real-time RT-PCR (B) of melanogenic enzymes. (A): The cells were treated with α-MSH (100 nM) and each chemical of designated concentration. (B): The cells were treated with α-MSH (100 nM) and arbutin (50 μM), mulberroside A (MUL, 5 μM), or oxyresveratrol (OXY, 5 μM). Data were normalized by using actin as a control. The values of normalized fold expression were determined from three independent experiments and expressed as mean values ± SD. The asterisks denote the statistic significance of p < 0.05, in comparison with the control which was normalized to 1.
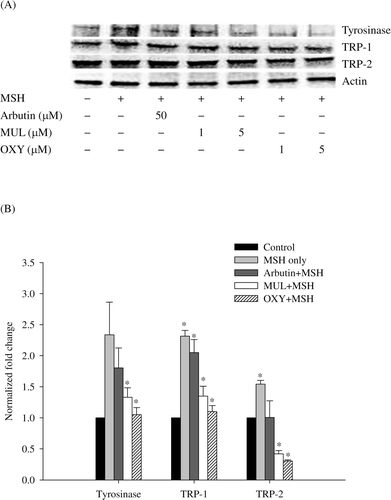
Figure 5.  Western blotting (A) and quantitative real-time RT-PCR (B) of melanogenic enzymes. (A): The cells were treated with α-MSH (100 nM) and each chemical of designated concentration. (B): The cells were treated with α-MSH (100 nM) and arbutin (50 μM), mulberroside A (MUL, 5 μM), or oxyresveratrol (OXY, 5 μM). Data were normalized by using actin as a control. The values of normalized fold expression were determined from three independent experiments and expressed as mean values ± SD. The asterisks denote the statistic significance of p < 0.05, in comparison with the control which was normalized to 1.

Reprints and Corporate Permissions

Please note: Selecting permissions does not provide access to the full text of the article, please see our help page How do I view content?

To request a reprint or corporate permissions for this article, please click on the relevant link below:

Academic Permissions

Please note: Selecting permissions does not provide access to the full text of the article, please see our help page How do I view content?

Obtain permissions instantly via Rightslink by clicking on the button below:

If you are unable to obtain permissions via Rightslink, please complete and submit this Permissions form. For more information, please visit our Permissions help page.