1,117
Views
16
CrossRef citations to date
0
Altmetric
Research Article

Pharmacophore generation and atom-based 3D-QSAR of novel quinoline-3-carbonitrile derivatives as Tpl2 kinase inhibitors

&
Pages 558-570 | Received 08 Feb 2011, Accepted 27 Jun 2011, Published online: 18 Aug 2011

Figures & data

Table 1.  Tpl2 kinase inhibition data of quinoline-3-carbonitrile and their analogues.

Figure 1.  Common pharmacophore for active ligands (three aromatic rings (grey circle)), one H-donor (blue sphere with single arrow) and one acceptor (pink sphere with one arrow).
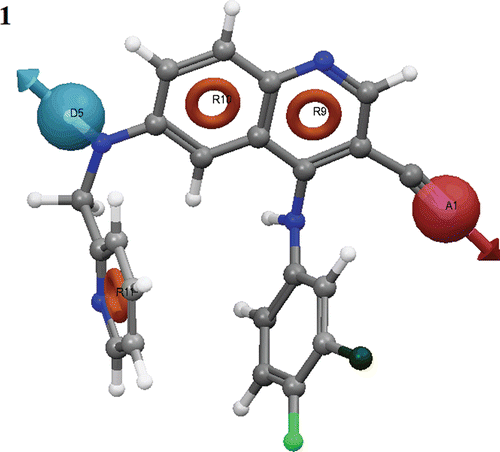
Figure 1.  Common pharmacophore for active ligands (three aromatic rings (grey circle)), one H-donor (blue sphere with single arrow) and one acceptor (pink sphere with one arrow).

Table 2.  The scores of different parameters of the ADRRR hypothesis.

Figure 2.  Common pharmacophoric sites of active ligands with distance.

Figure 2.  Common pharmacophoric sites of active ligands with distance.

Table 3.  PLS statistical parameters of the selected 3D-QSAR model.

Table 4.  Fitness and predicted activity data for the test and training set of compounds.

Figure 3.  Alignment of active and inactive ligands to the pharmacophore.

Figure 3.  Alignment of active and inactive ligands to the pharmacophore.

Figure 4.  Fitness graph between observed activity vs. Phase predicted activity for training and test set compounds.
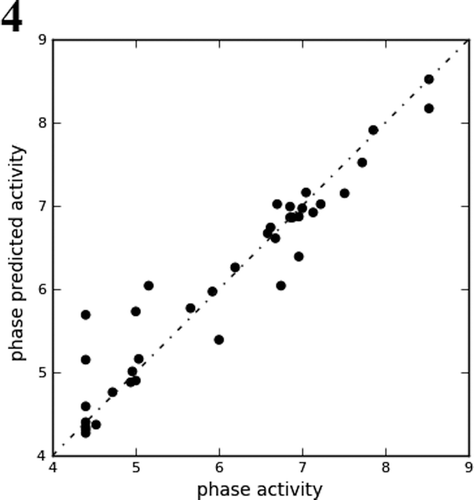
Figure 4.  Fitness graph between observed activity vs. Phase predicted activity for training and test set compounds.

Figure 5.  QSAR visualization of various substituents effect: (A) Electron withdrawing feature, (B) Hydrogen-bond donor, (C) Hydrophobic features, (D) Positive ionic and (E) Negative ionic.
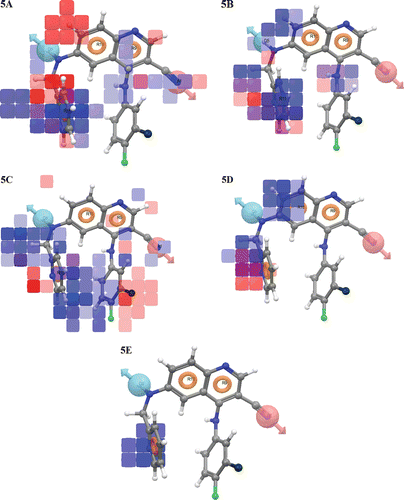
Figure 5.  QSAR visualization of various substituents effect: (A) Electron withdrawing feature, (B) Hydrogen-bond donor, (C) Hydrophobic features, (D) Positive ionic and (E) Negative ionic.

Table 5.  The ROC and a few performance measures derived from the number of true positives, true negatives, false positives and false negatives by confusion matrix.
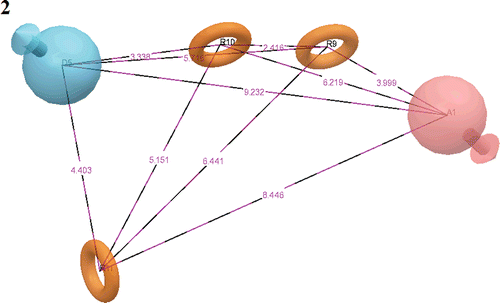
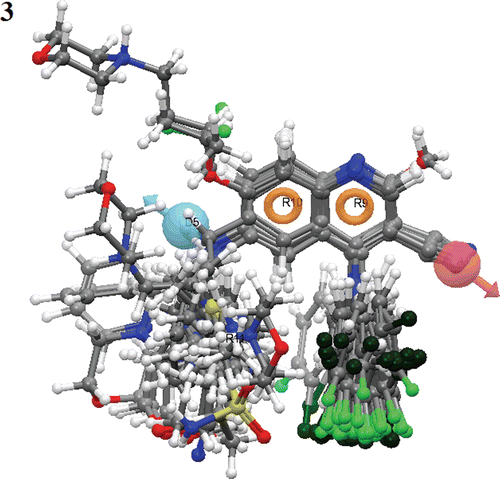
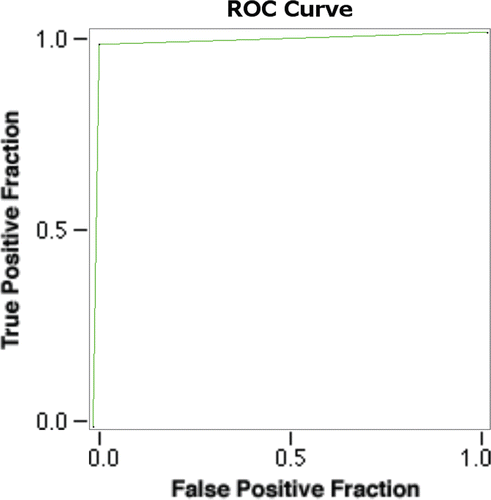
Figure 6.  The ROC curve between the true positive fraction and false positive fraction.

Figure 6.  The ROC curve between the true positive fraction and false positive fraction.

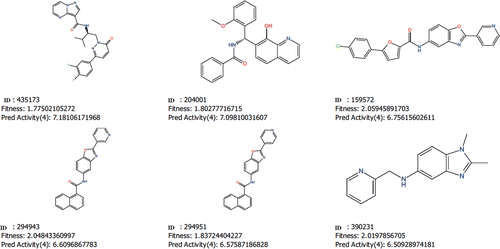
Figure 7.  The structure of six potential Tpl2 kinase inhibitors with their Asinex ID, fitness value and predicted activity.

Figure 7.  The structure of six potential Tpl2 kinase inhibitors with their Asinex ID, fitness value and predicted activity.
Supplemental material

Supplementary Material

Download PDF (37.7 KB)

Reprints and Corporate Permissions

Please note: Selecting permissions does not provide access to the full text of the article, please see our help page How do I view content?

To request a reprint or corporate permissions for this article, please click on the relevant link below:

Academic Permissions

Please note: Selecting permissions does not provide access to the full text of the article, please see our help page How do I view content?

Obtain permissions instantly via Rightslink by clicking on the button below:

If you are unable to obtain permissions via Rightslink, please complete and submit this Permissions form. For more information, please visit our Permissions help page.