1,121
Views
9
CrossRef citations to date
0
Altmetric
Research Article

Structure-based design and biochemical evaluation of sulfanilamide derivatives as hepatitis B virus capsid assembly inhibitors

, , , &
Pages 916-925 | Received 22 Mar 2012, Accepted 15 May 2012, Published online: 18 Jul 2012

Figures & data

Figure 1.  Constructed protein model and receptor–ligand interaction simulation. (A) Constructed Cp149 dimer model. Lateral view. (B) Constructed Cp149 dimer model. Ventral view. (C) Binding site candidate. Residues Ser35~His52 are depicted in stick model, and binding site is depicted as a coloured dot and pink sphere. (D) Binding simulation of sulfanilamide. Atoms in sulfanilamide are depicted as the ball, and nearby residues are depicted as lines. (E) Surfaces are added to residues described in (D). Sulfanilamide ligand is almost completely interlocked in the protein structure.
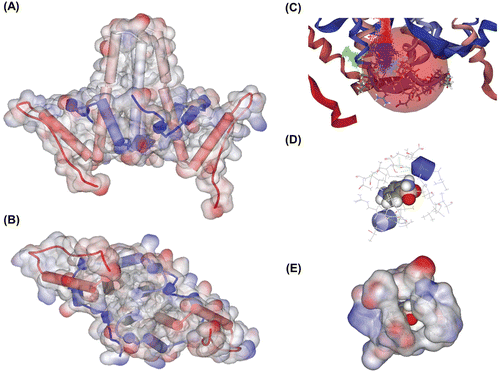
Figure 1.  Constructed protein model and receptor–ligand interaction simulation. (A) Constructed Cp149 dimer model. Lateral view. (B) Constructed Cp149 dimer model. Ventral view. (C) Binding site candidate. Residues Ser35~His52 are depicted in stick model, and binding site is depicted as a coloured dot and pink sphere. (D) Binding simulation of sulfanilamide. Atoms in sulfanilamide are depicted as the ball, and nearby residues are depicted as lines. (E) Surfaces are added to residues described in (D). Sulfanilamide ligand is almost completely interlocked in the protein structure.

Figure 2.  Random binding simulation and similarity search. (A)–(B) In this simulation, input molecules were allowed to bind at any site in the protein, thereby simulating random binding of the chemicals. Then we calculated binding energy to predict which poses could really be allowed and sustained. In sum, among the all possible binding poses, only a small number of poses were possible and about 80% of binding poses were located in the binding site we expected as in this figure. (A) Lateral view. (B) Ventral view. (C)–(D) Results of similarity search with molecular docking simulation. We used sulfanilamide as a lead compound, and several molecules expected to have better inhibition strength were detected. (C) Docked state of molecules. These molecules contain sulfanilamide structure as its substructure, and have higher binding strength. Total 125 molecule poses are depicted. (D) 10 molecules with highest binding strength. These molecules share similar conformation as seen above. They contain two aromatic ring structures and these rings are put on a roughly same plane, which means this two-plane structure could work as a scaffold for effective assembly inhibitor.
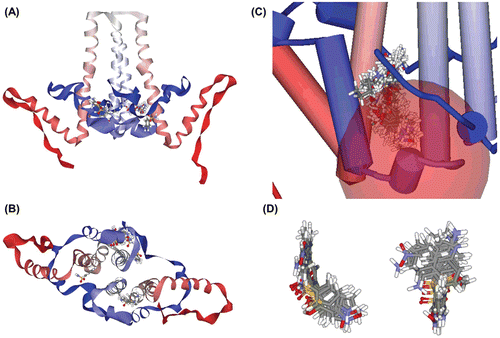
Figure 2.  Random binding simulation and similarity search. (A)–(B) In this simulation, input molecules were allowed to bind at any site in the protein, thereby simulating random binding of the chemicals. Then we calculated binding energy to predict which poses could really be allowed and sustained. In sum, among the all possible binding poses, only a small number of poses were possible and about 80% of binding poses were located in the binding site we expected as in this figure. (A) Lateral view. (B) Ventral view. (C)–(D) Results of similarity search with molecular docking simulation. We used sulfanilamide as a lead compound, and several molecules expected to have better inhibition strength were detected. (C) Docked state of molecules. These molecules contain sulfanilamide structure as its substructure, and have higher binding strength. Total 125 molecule poses are depicted. (D) 10 molecules with highest binding strength. These molecules share similar conformation as seen above. They contain two aromatic ring structures and these rings are put on a roughly same plane, which means this two-plane structure could work as a scaffold for effective assembly inhibitor.

Figure 3.  In vitro assay of Cp149 assembly. (A)–(D) In vitro Cp149 assembly was used to determine the inhibition efficiency of predicted candidates. We used DMSO and PMSF as a control, which could simulate benzenesulfonamide and sulfanilamide structure. Cp149 dimers were incubated for 1 h in 37°C condition with a given concentration of molecules (described above each gel image), and the products were resolved in 0.9% agarose gel (upper panel). Immunoblot analysis was carried out with Anti-HBcAg. Also, as a control, the products were resolved in SDS/15% polyacrylamide gel (lower panel), and immunoblot analysis was carried out with Anti-HBcAg. (A) Benzenesulfonamide, (B) Sulfanilamide, (C) DMSO, (D) PMSF. (E) Analysis of band intensity. The intensity of the band in agarose gel was divided to the intensity of the corresponding band in the SDS-Polyacrylamide gel, and these ratios were normalized to the band intensity ratios of nontreated Cp149 (Positive control) lanes. In each case, positive control lane was standard. (F) Sucrose gradient (10–50 % sucrose in 50 mM Hepes buffer, pH 7.5) centrifugation was carried out using samples assembled in vitro with or without given molecule. (−): Negative control (dimer form), (+): Positive Control (Capsid form).
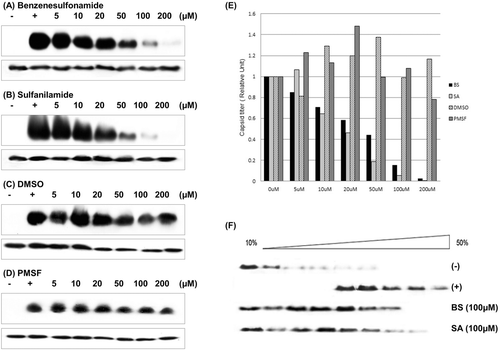
Figure 3.  In vitro assay of Cp149 assembly. (A)–(D) In vitro Cp149 assembly was used to determine the inhibition efficiency of predicted candidates. We used DMSO and PMSF as a control, which could simulate benzenesulfonamide and sulfanilamide structure. Cp149 dimers were incubated for 1 h in 37°C condition with a given concentration of molecules (described above each gel image), and the products were resolved in 0.9% agarose gel (upper panel). Immunoblot analysis was carried out with Anti-HBcAg. Also, as a control, the products were resolved in SDS/15% polyacrylamide gel (lower panel), and immunoblot analysis was carried out with Anti-HBcAg. (A) Benzenesulfonamide, (B) Sulfanilamide, (C) DMSO, (D) PMSF. (E) Analysis of band intensity. The intensity of the band in agarose gel was divided to the intensity of the corresponding band in the SDS-Polyacrylamide gel, and these ratios were normalized to the band intensity ratios of nontreated Cp149 (Positive control) lanes. In each case, positive control lane was standard. (F) Sucrose gradient (10–50 % sucrose in 50 mM Hepes buffer, pH 7.5) centrifugation was carried out using samples assembled in vitro with or without given molecule. (−): Negative control (dimer form), (+): Positive Control (Capsid form).

Figure 4.  Affinity analysis with surface plasmon resonance. FC1: Negative control (blank), FC2: Cp149 (WT), FC3: Cp149 (BS-treated), FC4: Cp149 (SA-treated). Four concentrations of Cp149 (WT) and Cp149-molecule complexes were passed through the flow cell with the flow rate of 60 µL/min. Sensorgrams were analyzed using the BIA evaluation software and the results are shown in .
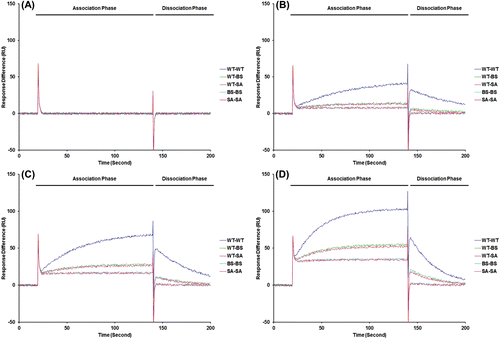
Figure 4.  Affinity analysis with surface plasmon resonance. FC1: Negative control (blank), FC2: Cp149 (WT), FC3: Cp149 (BS-treated), FC4: Cp149 (SA-treated). Four concentrations of Cp149 (WT) and Cp149-molecule complexes were passed through the flow cell with the flow rate of 60 µL/min. Sensorgrams were analyzed using the BIA evaluation software and the results are shown in Table 1.

Table 1.  Sensorgrams of the interaction between free and molecule-bound dimeric Cp149.

Figure 5.  Determination of binding site with deuterium exchange-mass spectrometry. (A) Mass peak of partially digested Cp149. Mass profiles of samples were analyzed to identify mass shift caused by deuterium substitution and its difference. When the molecule was treated, the deuterium substitution rate is decreased and mass of fragments is lowered. (B) Mass shift difference values were normalized to the strongest value, and substitution rate for each AA was calculated for each. (C) and (D) Cp149 dimer model, coloured with DXMS mass shift difference values. Strongest signals were found in AA 34–42 and AA 49–54, which is nearly identical to the location of the binding site we proposed. This mass shift difference was expected to be caused by shadowing effect of sulfanilamide.
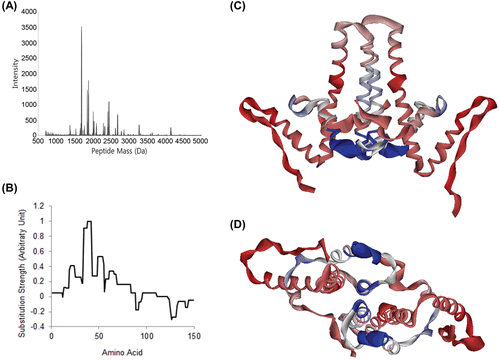
Figure 5.  Determination of binding site with deuterium exchange-mass spectrometry. (A) Mass peak of partially digested Cp149. Mass profiles of samples were analyzed to identify mass shift caused by deuterium substitution and its difference. When the molecule was treated, the deuterium substitution rate is decreased and mass of fragments is lowered. (B) Mass shift difference values were normalized to the strongest value, and substitution rate for each AA was calculated for each. (C) and (D) Cp149 dimer model, coloured with DXMS mass shift difference values. Strongest signals were found in AA 34–42 and AA 49–54, which is nearly identical to the location of the binding site we proposed. This mass shift difference was expected to be caused by shadowing effect of sulfanilamide.

Figure 6.  Electron micrographs of assembled core particles. Electromicrographs of nontreated Cp149 and molecule-treated Cp149 capsids (Magnification: ×80,000). Assembled core particles were negatively stained with 2 % uranyl acetate. (A) Nontreated cp149 was assembled in reaction buffer (50 mM Hepes, 15 mM NaCl and 10 mM CaCl2 in pH 7.5). (B) and (C) Benzenesulfonamide-/sulfanilamide-treated cp149 core was assembled in reaction buffer. (B) Benzenesulfonamide, (C) Sulfanilamide. (D) Types of capsids are described. 1: Normal capsids. Black outer masses are considered to be uranyl acetate remnants. 2: Broken capsid. The arrow indicates a broken site. 3: Small capsid (expected to be T = 3 capsid). Red arrow indicates small capsid, which is relatively smaller than the normal capsid indicated by black arrows. 4: Aggregate. The arrow indicates Cp aggregate.
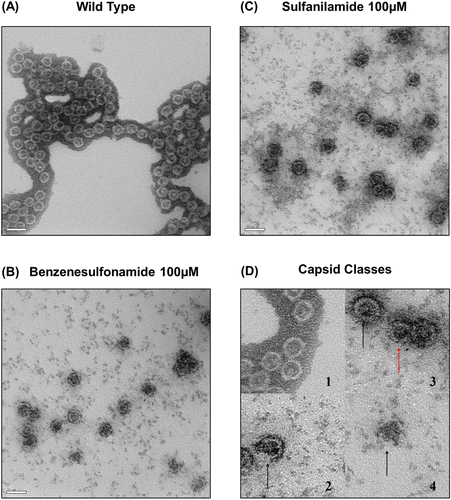
Figure 6.  Electron micrographs of assembled core particles. Electromicrographs of nontreated Cp149 and molecule-treated Cp149 capsids (Magnification: ×80,000). Assembled core particles were negatively stained with 2 % uranyl acetate. (A) Nontreated cp149 was assembled in reaction buffer (50 mM Hepes, 15 mM NaCl and 10 mM CaCl2 in pH 7.5). (B) and (C) Benzenesulfonamide-/sulfanilamide-treated cp149 core was assembled in reaction buffer. (B) Benzenesulfonamide, (C) Sulfanilamide. (D) Types of capsids are described. 1: Normal capsids. Black outer masses are considered to be uranyl acetate remnants. 2: Broken capsid. The arrow indicates a broken site. 3: Small capsid (expected to be T = 3 capsid). Red arrow indicates small capsid, which is relatively smaller than the normal capsid indicated by black arrows. 4: Aggregate. The arrow indicates Cp aggregate.

Table 2.  Capsid particles in each case.

Reprints and Corporate Permissions

Please note: Selecting permissions does not provide access to the full text of the article, please see our help page How do I view content?

To request a reprint or corporate permissions for this article, please click on the relevant link below:

Academic Permissions

Please note: Selecting permissions does not provide access to the full text of the article, please see our help page How do I view content?

Obtain permissions instantly via Rightslink by clicking on the button below:

If you are unable to obtain permissions via Rightslink, please complete and submit this Permissions form. For more information, please visit our Permissions help page.