Figures & data
Figure 1. (a) Toyopearl Super-Q chromatography of acetone extract of AS (15 mg). The column (29 × 1.6 cm) was equilibrated with 0.05M Tris-HCl buffer, pH 8.0 and a linear NaCl gradient (0–0.6 M) in 0.05 M Tris-HCl buffer was used for elution. Flow rate was 0.6 mL/min. ASa: tubes 5–12, ASb: tubes 110–135 and ASc: tubes 143–155. Approximately 95% inhibition of trypsin was observed for fraction ASb and less than 10% was observed for ASa and ASc. (b) Affinity chromatography of fraction ASb using a trypsin-agarose column (1 mL). The column was equilibrated with 10 mM acetic acid and 20 mM HCl was used for elution. Flow rate was 0.5 mL/min. ASb1: tubes 2–5, ASb2: tubes 8–11. (c) RP-HPLC of fraction ASb2 (500 µg) on a Grace Vydac C-18 RP column. The column was equilibrated with 0.1% (v/v) TFA/water. Elution was performed with an acetonitrile gradient at a flow rate of 1 mL/min.
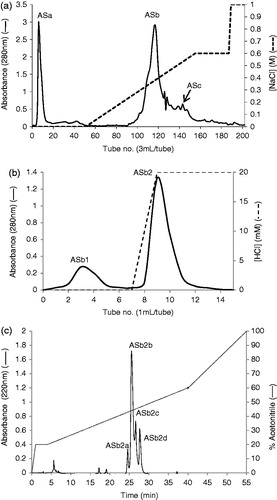
Table 1. Purification table of ASTI from 5 g starting material.
Figure 2. Reducing SDS-PAGE patterns of ASTI purified by affinity chromatography and RP-HPLC. Lane 1, MW markers; lane 2, affinity purified fraction (ASb2) and lane 3, RP-HPLC purified fraction (ASb2b). 50–10 refer to kilo Dalton values of molecular weight markers.
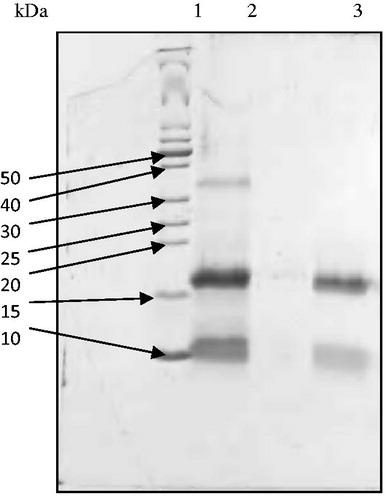
Figure 3. (a) Separation of peptides generated by digestion of ASTI A-chain with S. aureus V8 protease. Peptides were separated by RP-HPLC on a TSK gel ODS 120 T column using a gradient of acetonitrile in 0.1% TFA. Flow rate was 1.0 mL/min. (b) Separation of peptides generated by digestion of ASTI A-chain with endoproteinase Arg-C. Peptides were separated by RP-HPLC on a TSK gel ODS 120 T column using a gradient of acetonitrile in 0.1% TFA. Flow rate was 1.0 mL/min. (c) Separation of peptides generated by digestion of ASTI A-chain with Achromobacter protease I. Peptides were separated by RP-HPLC on a TSK gel ODS 120 T column using a gradient of acetonitrile in 0.1% TFA. Flow rate was 1.0 mL/min.
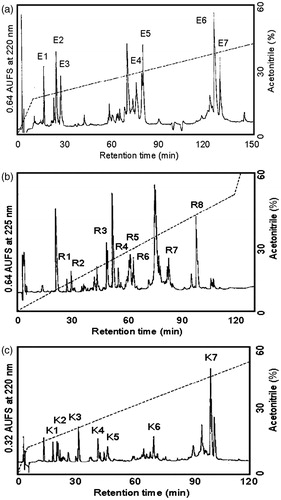
Figure 4. Amino acid sequence of the A- and B-chain of ASTI, deduced from protease digestions, RP-HPLC and sequence analysis. (E), S. aureus V8 protease digest of A-chain; (K), Achromobacter protease 1 digest of A-chain and (R), endoproteinase Arg-C digest of A-chain.
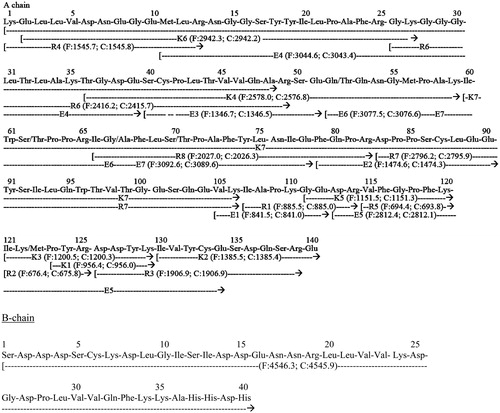
Figure 5. (a) Alignment between the sequence of the A-chain of ASTI with other comparative plant seed inhibitor sequences obtained from ClustalW search. Comparative sequences are obtained with Kunitz-type trypsin inhibitor A chain, ACTI-A (A. confusa), gi|299509|; Kunitz-type trypsin inhibitor A-chain, LLTI-A (L. leucocephala), gi|18202442|; trypsin inhibitor A-chain, BVTI-A (Bauhinia variegata), gi|15082208| and KTI A-chain, KTI-A gi|162138868|. (*), Identical sequences; (:), similarities of three or four amino acids. (b) Alignment between the sequence of the B-chain of ASTI with other comparative plant seed inhibitor sequences obtained from ClustalW search. Comparative sequences are obtained with Kunitz-type trypsin inhibitor B-chain, ACTI-B (A. confusa), gi|299508|; SBTI and Kunitz-type trypsin inhibitor B-chain, LLTI-B (L. leucocephala), gi|18202443|. (*), Identical sequences; (:), similarities of three or four amino acids.
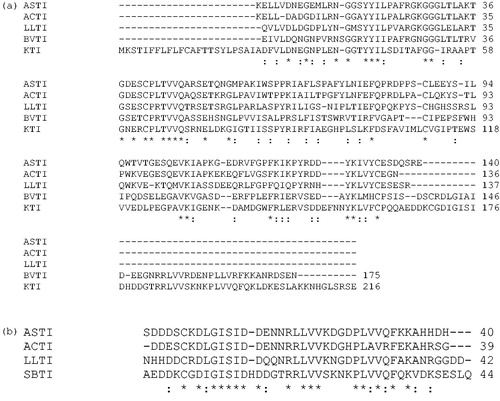
Figure 6. A phylogenetic tree analysis of ASTI with other inhibitors. Protein sequences were obtained from http://blast.ncbi.nlm.nih.gov/ by a BLAST search of ASTI. Accession numbers for the sequences used are as follows: trypsin isoinhibitor (Adenanthera pavonina), APTI, gi|225058|; LLTI, gi|18202442|; Prosopis juliflora trypsin inhibitor, PJTI, gi|417176|; ACTI, gi|299509|; Tamarindus indica trypsin inhibitor, TITI, gi|308756025|; BVTI, gi|32363181|; Bauhinia ungulate Factor X inhibitor, BUXI, gi|32363179|; Psophocarpus tetragonolobus trypsin inhibitor, PTTI, gi|86450987 and chymotrypsin inhibitor (Erythrina variegate), gi|265716|. The scale bar shows a branch length of 0.1 (i.e. a 10% difference in amino acids).
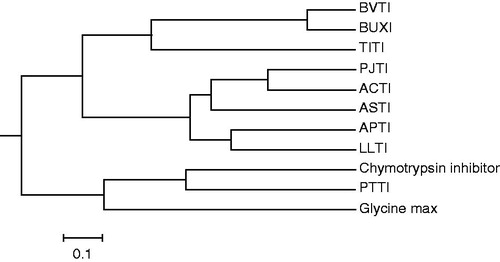
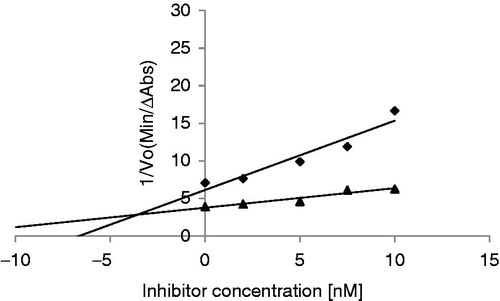
Figure 7. Double–Dixon plot to determine the inhibition constant (Ki) of ASTI interacting with bovine trypsin. Substrate concentrations of 25 and 5 mM were used. Bovine trypsin concentration was 1 nM. 25 mM (♦) (R2 = 0.913) and 5 mM (R2 = 0.920) (▴).