Figures & data
Table 1. In vitro cytotoxicity of naphthyridine derivatives*.
Table 2. Summary of analytical parameters of chromatographic methods used for sample analysis of various in vitro and in vivo ADME assays.
Table 3. In vitro ADME properties and structure correlation of naphthyridine derivatives.
Table 4. Partition coefficient, plasma protein binding, Caco-2 permeability and plasma stability of naphthyridine derivatives.
Figure 1. Inhibition of cytochrome P450 enzyme isoforms (A) CYP1A2, (B) CYP2C9, (C) CYP2D6, (D) CYP3A4 and (E) CYP2C19. The ability of compounds at 10 µM to inhibit substrate of five specific CYP enzymes was analyzed using fluorometric microtiter plate assay. Data shown are mean ± SEM of three independent experiments. ** and *** represent p < 0.05, p < 0.01 and p < 0.001 when compared with other compounds in the study.
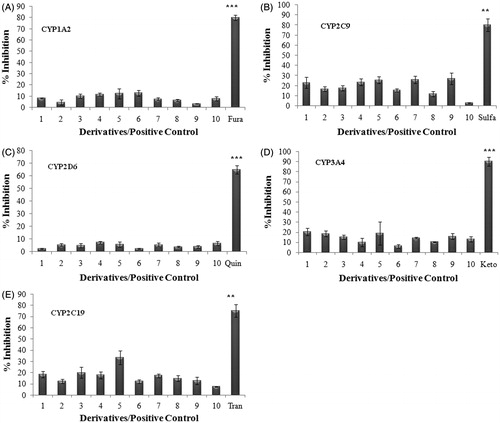
Figure 2. (A) Plasma concentration profile of derivatives 5 (squares) and 6 (diamond) following intravenous administration at 5.0 mg/kg dose in Wistar rat. Data shown in mean ± SD (n = 4). (B) Plasma and tumor concentration profiles of 5 and 6 following intravenous administration at 5.0 mg/kg dose in tumor-bearing mice (TBM). Data shown in mean ± SD (n = 4). Plasma and tumor concentration (µg/mL) determined by HPLC.
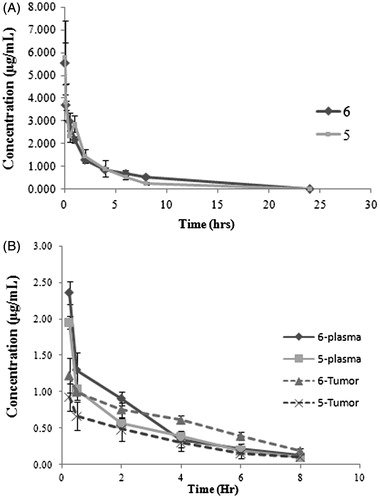
Table 5. Mean pharmacokinetic parameters of shortlisted naphthyridine derivatives following intravenous administration in Rat and Tumor bearing mouse (TBM) at intravenous dose of 5.0 mg/kg.*.
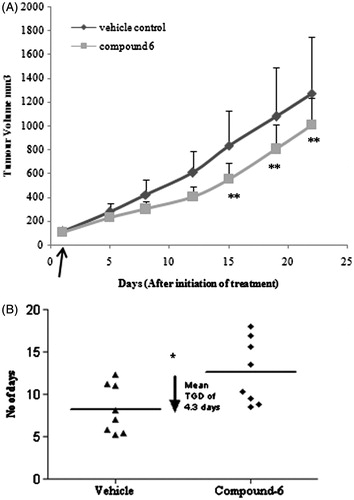
Figure 3. In vivo antitumor activity of derivative 6. (A) Derivative 6 showed 33% tumor growth inhibition (TGI) against human ovarian xenograft model. Curve indicates the tumor volumes of ovary (PA1) tumor-bearing mice of vehicle-treated (circle) and derivative 6-treated (square) groups at i.v. dose of 5.0 mg/kg once daily for 14 day. **Represents p < 0.01 when compared with untreated group (B) Dotplot of derivative 6 showed mean tumor growth delay (TGD) of 4.3 days to reach the 4x tumor volume. Linear regression y = 45.41x + 56.45(R2 = 0.998) and y = 26.88x + 84.24(R2 = 0.99) was followed for time to reach 4x start volume for vehicle and treated group, respectively. *represents p < 0.05 when compared with untreated group (Mann–Whitney U test). Horizontal line (–) indicates the mean value. The Data shown are mean ± SD (n = 8). Arrow indicates start of the treatment.