Figures & data
Figure 1. (left) O-acetylsalicylic acid (aspirin) and (right) its complex Ag(tpp)3(asp).
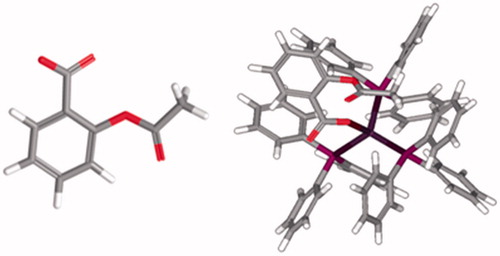
Figure 2. 1H NMR spectrum of the complex Ag(tpp)3(asp) in DMSO-d6: (top) aliphatic region and (bottom) aromatic region.
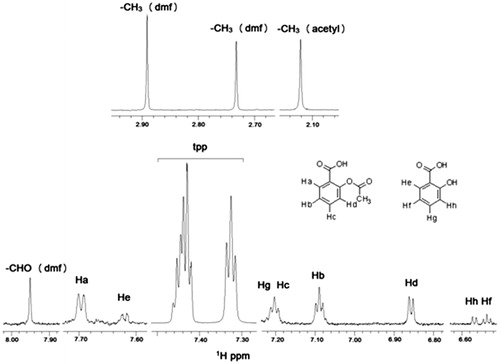
Figure 3. 1H NMR spectrum of soybean LOX-1 with complex Ag(tpp)3(asp) in Tris/D2O: (top) without sonication and (bottom) after sonication.
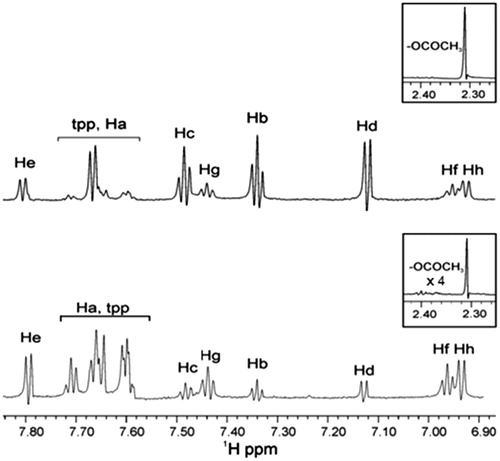
Figure 4. STD experiment of 1H NMR of soybean LOX-1 with complex Ag(tpp)3(asp) in Tris/D2O (without sonication): the reference NMR spectrum of aliphatic and aromatic region (top), and the STD NMR spectrum of aromatic region (bottom).
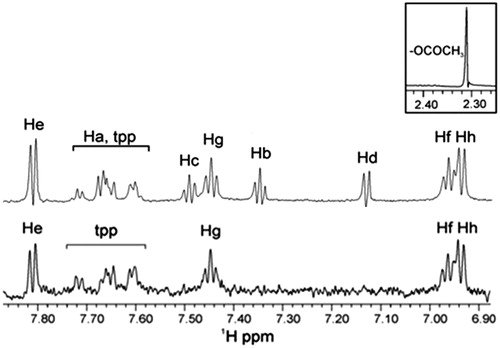
Figure 5. STD 1H NMR of soybean LOX-1 with complex Ag(tpp)3(asp) in Tris/D2O (after sonication): the reference NMR spectrum of aliphatic and aromatic regions (top), and on-resonance STD NMR spectrum of aromatic region (bottom).
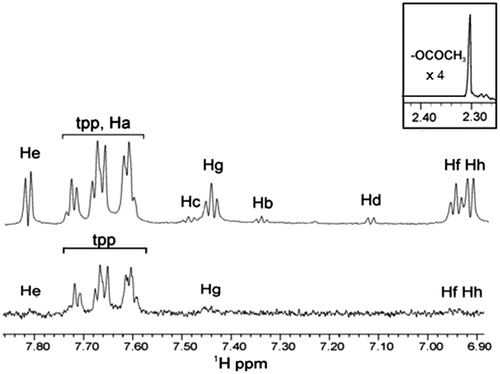
Figure 6. Ligand map (dotted lines: hydrogen bonds) of the complex of (a) aspirin and (b) salicylic acid in the cavity of LOX-1 (1F8N).
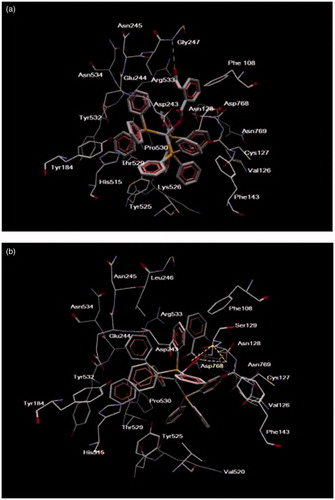
Figure 7. The Ag complex inside binding cavity of LOX-1. The atom of Fe(II) in the active site of cavity 1 is also displayed.
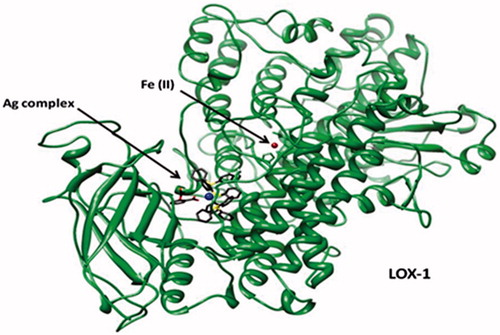
Figure 8. RMSD of LOX-1 bound to (a) Ag complex (salicylic) and (b) Ag complex (aspirin). RMSD values for the apo form of LOX-1 and for the two Ag complexes in the bound-protein systems are also shown. Calculations were initiated from each structure obtained after docking and overlapped on the same structure. For LOX-1 and Ag complexes, superposition involved Cα atoms and all heavy atoms, respectively.
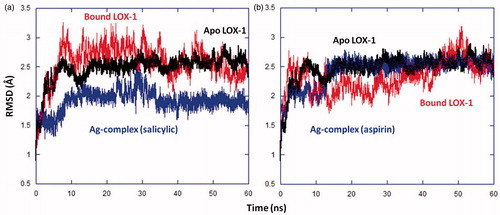
Figure 9. Cα atomic fluctuations for all residues of LOX-1 in its apo, and Ag complex-bound forms.
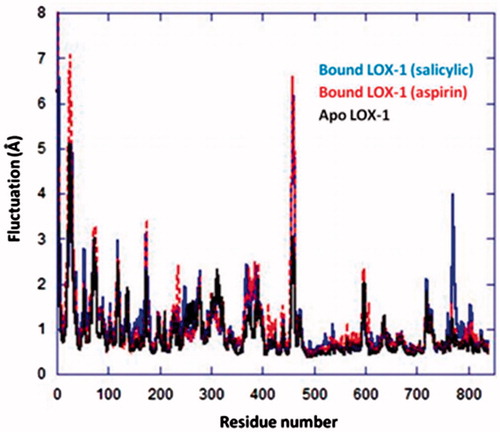
Figure 10. Hydrogen bonds between Ag complex and residues in binding cavity of LOX-1 for (a) the aspirin complex and (b) the salicylic complex. Interactions are represented by dotted lines, and involve oxygen atoms (red) in the aspirin/salicylic moiety of Ag complex. Ag(I) and P atoms are shown in blue and yellow, respectively; for simplicity, the hydrogen atoms of Ag complex are not shown.
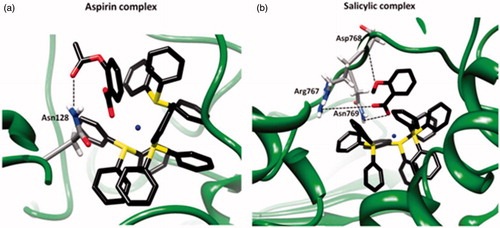
Table 1. Hydrogen bonding interactions between Ag complexes and LOX-1.
Table 2. MM-PBSA energy calculations* for the two Ag complexes in LOX-1.
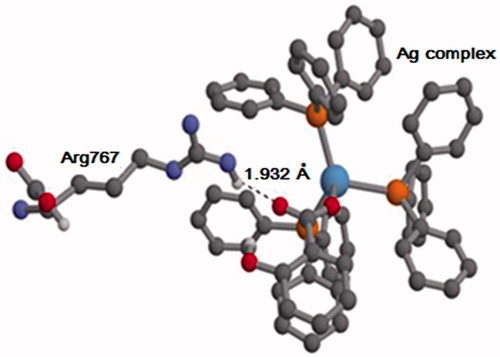
Figure 11. The geometry of Arg767 and the Ag complex (salicylic), as obtained from the MD trajectory. For clarity, only some of the hydrogen atoms are shown. O, C, N, P, Ag and H atoms are shown in red, gray, violet, orange, blue and white, respectively.