Figures & data
Figure 1. Structures of naphthoquinones investigated here as anti-P. falciparum compounds.
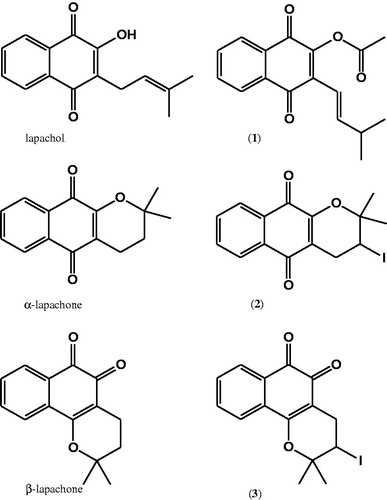
Table 1. In vitro antiparasitic activity and cytotoxicity.
Figure 2. Antiparasitic activity of compound 1 in the cell-cycle development of blood-stage P. falciparum. Erythrocytes were infected with W2 strain P. falciparum (synchronized to ring stage) and incubated with compound 1 at 2.3 and 4.7 µM during one cycle. Parasites were analyzed by optical microscopy in different times. Significance in reference to % of parasitemia: *p < 0.05; ***p < 0.001.
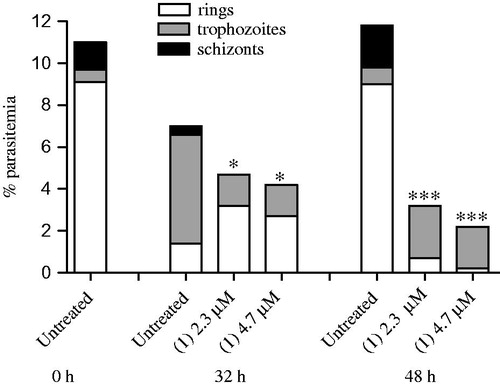
Table 2. Effects on the hematin formation and hemolysis.
Figure 3. TEM analysis of P. falciparum. Parasites were treated with 2.3 µM of compound 1 and incubated for 24 h. Panels A and B show untreated parasites, highlighting the presence of hemozoin crystals inside the digestive vacuoles. Panel C and D show treated parasites, where is possible to observe the hemozoin crystal absence. Panel E exhibits the number of parasites containing hemozoin crystals.
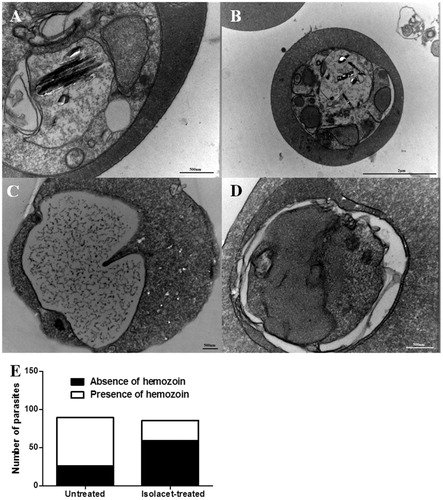
Figure 4. DNA fragmentation in W2 strain P. falciparum incubated with compound 1. Parasites were incubated with 0.05% DMSO (untreated), DNAse (positive control) or compound 1 and then analyzed by flow cytometry by using to the terminal deoxynucleotidyltransferase-mediated dUTP nick end labelling assay (TUNEL). One experiment was performed, in triplicate. *p < 0.001 in comparison to untreated cells.
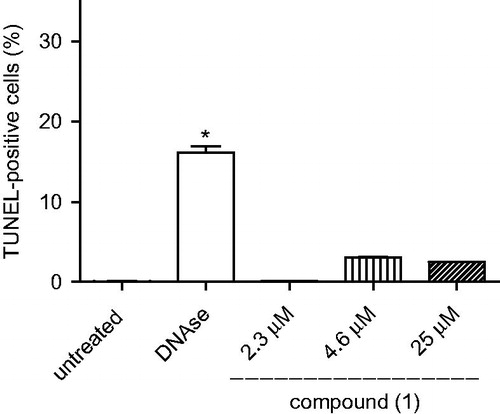
Figure 5. (A) Blood parasitemia and (B) survival in P. berghei-infected mice. Swiss Webster mice (n = 5/group) were infected with P. berghei and then treated daily for four consecutive days. Compound 1 was given by intraperitoneal injection, chloroquine by oral gavage. Values represent the means ± SEM of one experiment (n = 5). (A) *p < 0.05; **p < 0.01; ***p < 0.001 in comparison to vehicle group. (B) According to the Log-rank (Mantel Cox) analysis, there is no statistically significance between vehicle and compound 1.
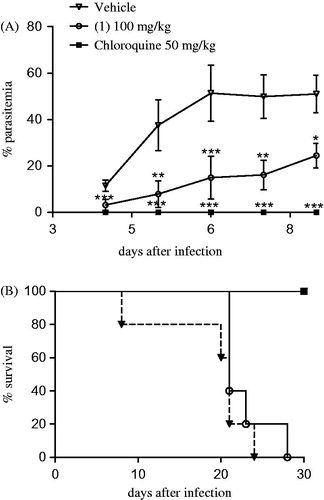
Table 3. Antimalarial activity in P. berghei-infected mice.
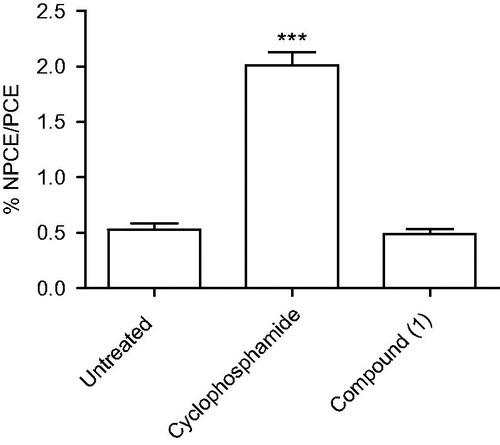
Figure 6. Frequency of micronucleated polychromatic erythrocytes (NPCE) observed in Swiss Webster mouse bone marrow. Swiss mice (n = 5/group) received intraperitoneal injection of saline (untreated), cyclosphophamide (50 mg/kg) and compound 1 (100 mg/kg). After 18 to 24 h of treatment, the percentage of NPCE was determined relatively to 8000 polychromatic erythrocytes (PCE) per group. Values represent the means ± SEM of one experiment (n = 5/group). ANOVA, ***p < 0.001 in comparison to untreated group.