Figures & data
Figure 1. SDS-PAGE analysis of purified hPON1. Lane (A) is standard proteins (kD): Bovine serum albumin (66.000), aldolase (47.500), triosephosphate isomerase (32.000) and soy bean trypsin inhibitor (24.000). Lane B contains a human serum sample.
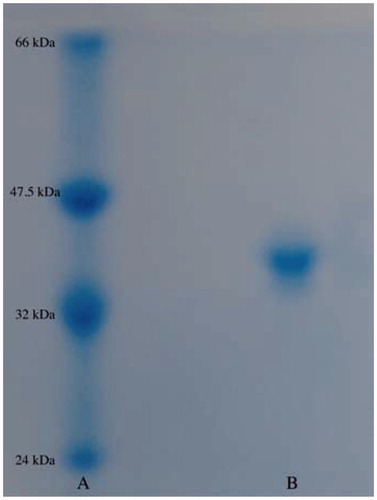
Figure 2. In vitro effect of antibacterial drugs: (a) moxifloxacin hydrochloride, (b) levofloxacin hemihidrate, (c) cefepime hydrochloride, (d) cefotaxime sodium and (e) ceftizoxime sodium at five different concentrations on hPON1 activity.
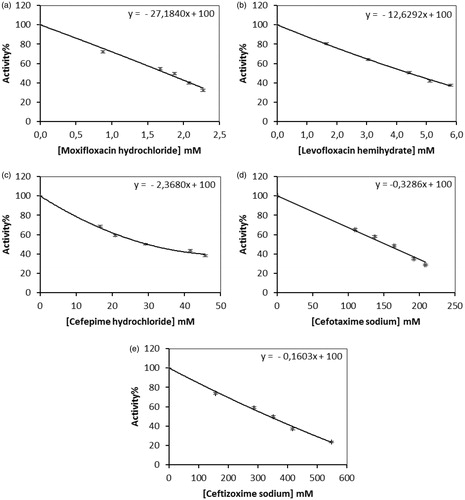
Figure 3. Ki graphs for paraoxonase from human serum. (a), (b), (c) and (d) Lineweaver–Burk graphs in five different substrate (paraoxon) concentrations and three different (a) moxifloxacin hydrochloride, (b) levofloxacin hemihidrate, (c) cefepime hydrochloride, (d) cefotaxime sodium and (e) ceftizoxime sodium concentrations for determination of Ki.
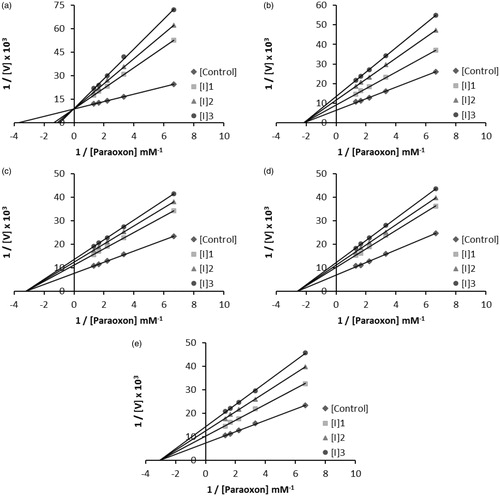
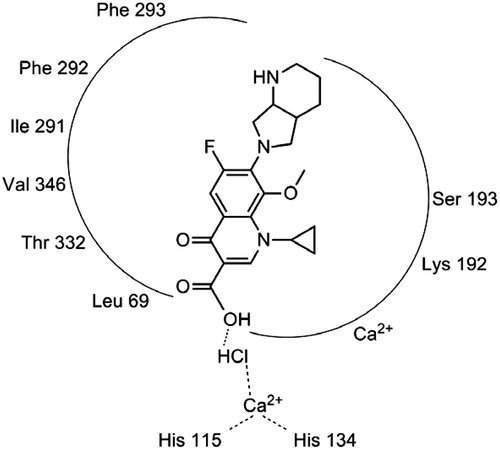
Figure 4. Schematic representation for the interaction of moxifloxacin hydrochloride (a) with the hPON1 active site.