Figures & data
Figure 1. Structures of currently used front line antituberculotics and direct InhA inhibitor triclosan.
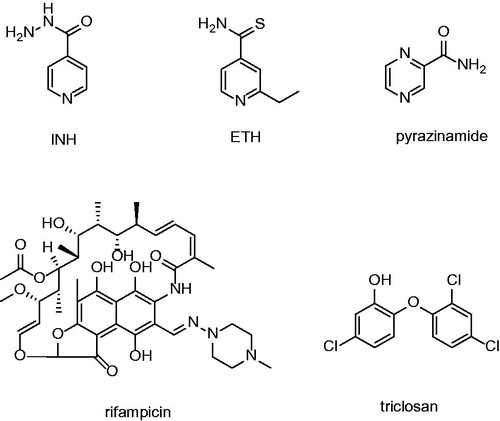
Figure 2. FAS II pathway; FabH: β-ketoacyl-ACP synthase; MabA: 3-ketoacyl-ACP reductase; InhA: Enoyl-ACP-reductase and KasA, KasB: β-ketoacyl-ACP synthase. KasA is specific for shorter chain substrates, KasB utitlizes longer chain substrates.
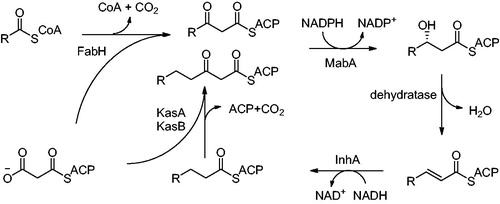
Table 1. Structures and in vitro results of notable InhA inhibitors.
Figure 3. General structure of diphenyl ethers (1–6) published by Sullivan et al.; n = 1,3–5,7,13.
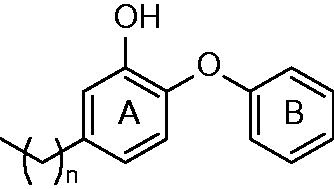
Figure 4. Structures of InhA inhibitors developed by Ende et al. R: NO2, NH2 and -NHCOCH3.
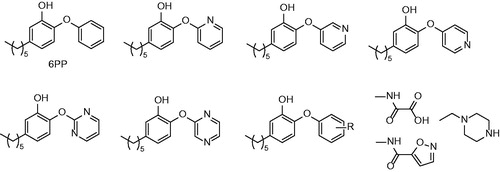
Figure 5. Structures of triclosan analogues published by Freundlich et al.; R: aliphatic, aromatic or heteroaromatic substitution; R': Cl and CN.
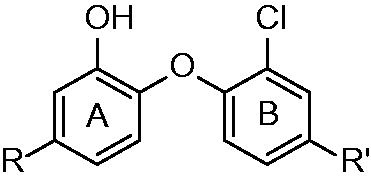
Figure 6. Tight binding diphenyl ether InhA inhibitor PT70 (36).
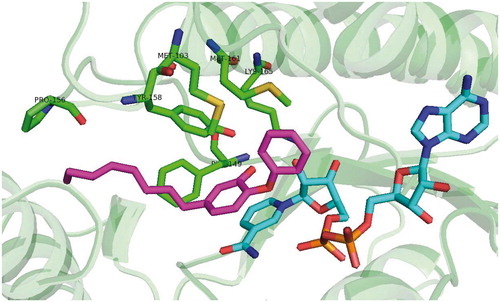
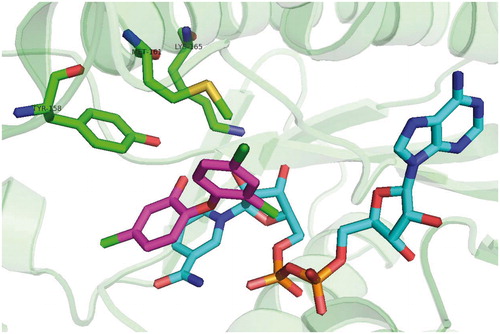
Scheme 1. Alkyl substituted diphenylether inhibitor (5) binding mode (pdb no. 2B37).
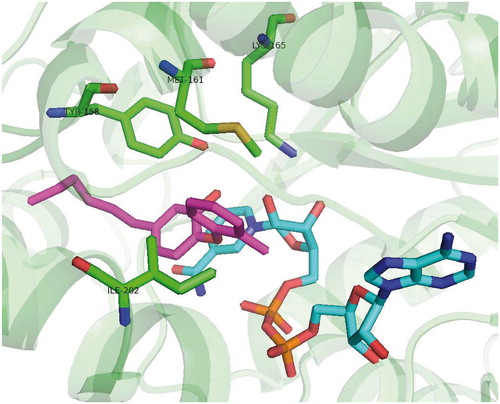
Scheme 2. Triclosan binding mode, pdb no: 3FNF (24).
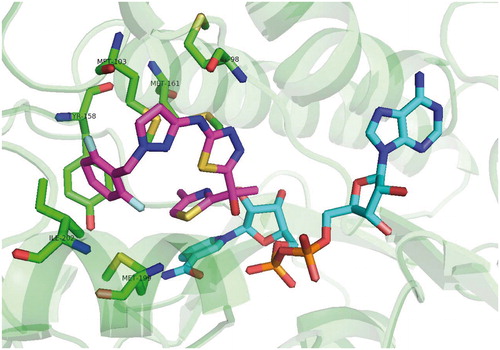
Scheme 3. PT70 (36) binding mode, pdb no. 2X23.
Scheme 4. Genz 10850 (45) binding mode, pdb no. 1P44.
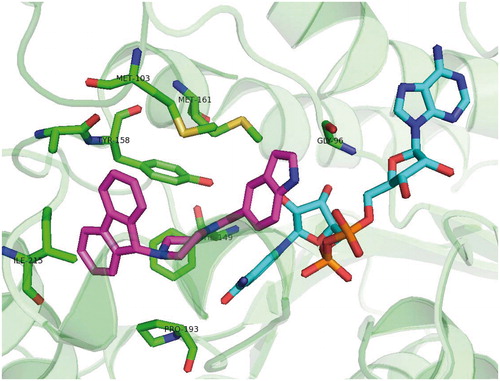
Figure 7. General structures of compounds published by Pan and Tonge and colleagues in 2014; R: NO2, NH2, CH3, Cl, Br, CF3, I, F, OH and CN.
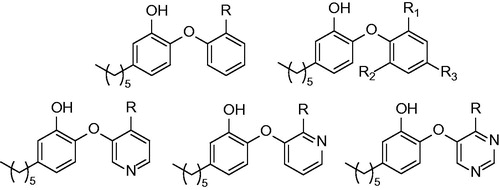
Figure 8. Structure of two inhibitors from Genzyme compound library.
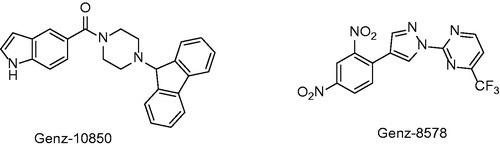
Figure 9. General structure of two triazole derivatives classes. R: H and Cl; R’: Me, OMe and NO2; R’’: phenyl, cyclohexyl and alkyl; n = 1–2.
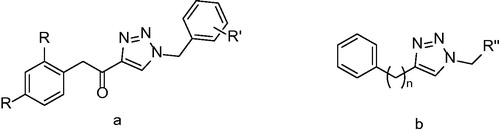
Figure 10. General structure of triazole potential inhibitors derived from previously published class b compounds. R: halogen, Me and OMe and n: 5–11.
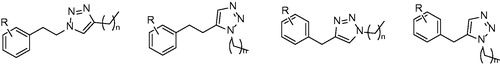
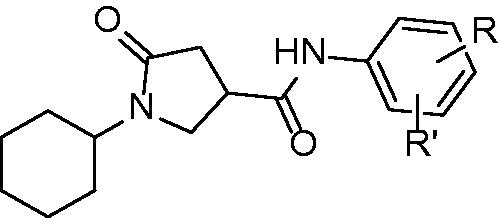
Figure 11. General structure of pyrrolidne carboxamide InhA inhibitors.
Scheme 5. Pyrrolidine carboxamide derivative binding mode, pdb no 2H7M.
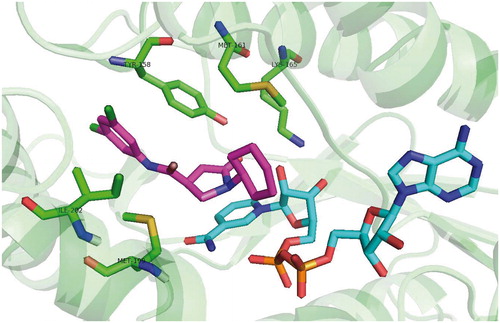
Figure 12. General structure of pyrrolidine-2,5-diones. R: acyl group, akyl, aryl and β-amide.
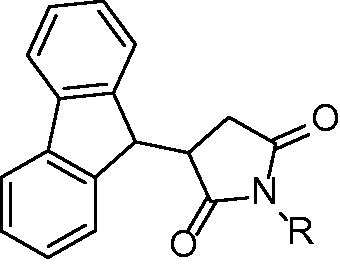
Figure 13. General structures of arylamides R1: small aliphatic or aromatic substituents and R2: Cl, CF3 and NO2.
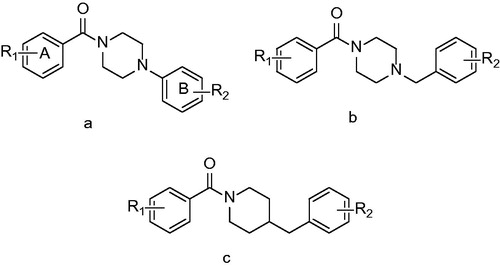
Figure 14. Compounds selected from Pharmacophore modeling study.
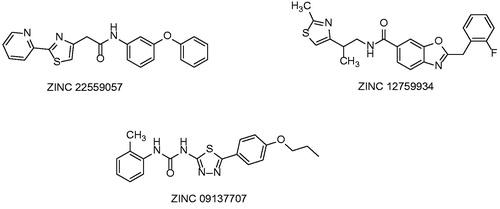
Figure 15. Compounds selected by exhaustive molecular docking published by Pauli et al.
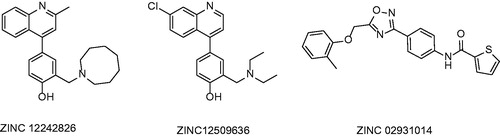
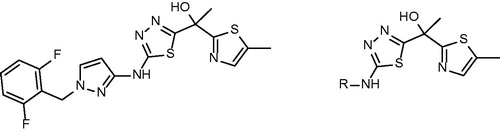
Figure 16. Methyl-thiazole lead sructure and its derivatives published by Shirude et al.
Scheme 6. Arylamides binding mode.
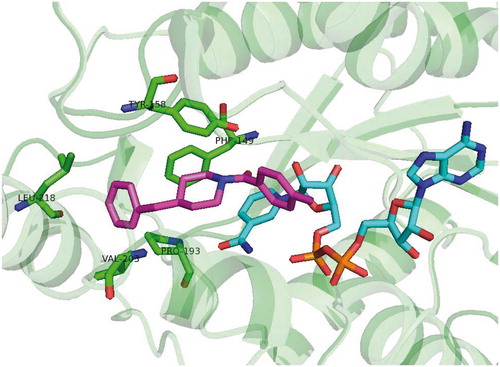
Scheme 7. Methyl-thiazole “Tyr158 out” binding mode.