Figures & data
Table 1. Active ERβ agonists used in the enriched dataset.
Figure 1. Results of the self-docking study. For each procedure the average RMSD (Å) is reported.
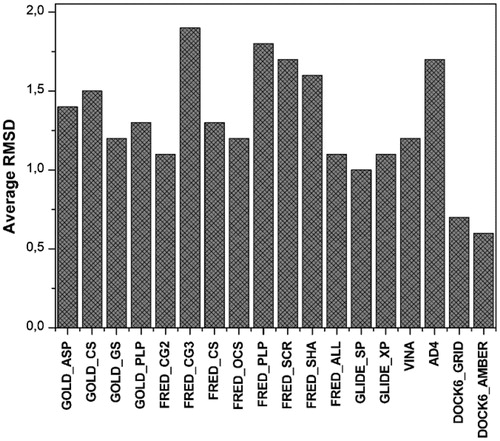
Figure 2. Results of the cross-docking study. The average RMSD (A) and the number of poses with a RMSD less than 2 Å (B) is reported.
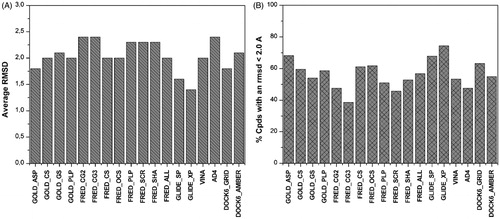
Figure 3. AUC (black) and EF10% (white) values of the first enriched dataset using each scoring function.
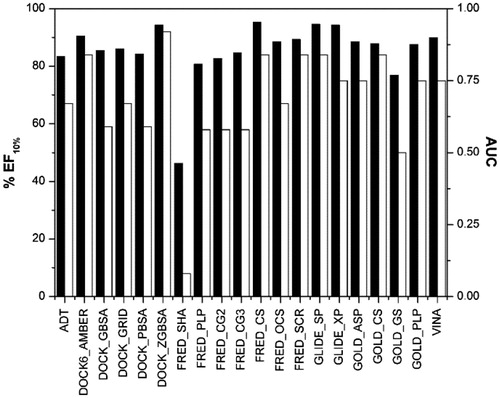
Figure 4. AUC (black) and EF10% (white) values of the second enriched dataset using each scoring function.
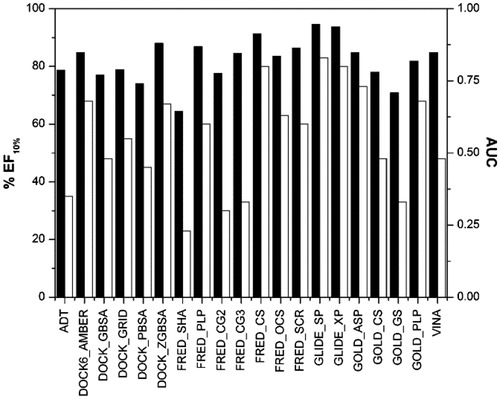
Figure 5. Virtual screening workflow. *The compounds that after the docking calculation showed the two H-bonds with H475 and the E305-R346 network system were taken into account. **The compounds that maintained the H-bonds with H475 and the E305-R346 network system for at least the 75% of MD simulation were considered.
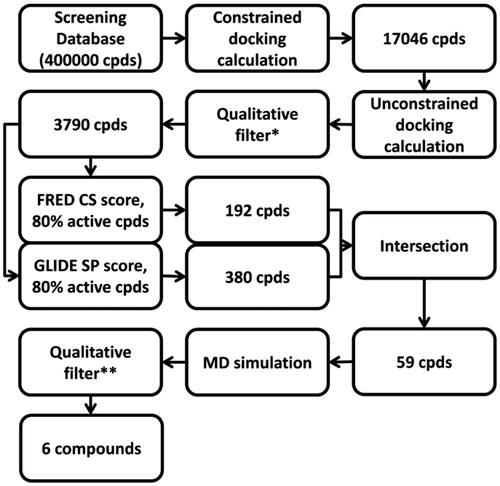
Figure 6. Rescoring results for the enriched database using GLIDE (A) and FRED (B). The grey vertical line corresponds to the threshold used for filtering the compounds.
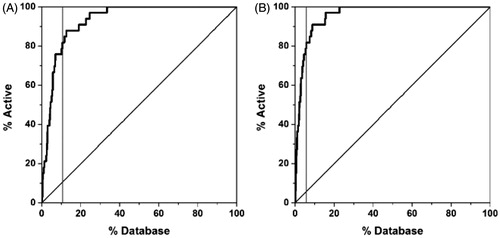
Table 2. Hypothetical lead compounds.
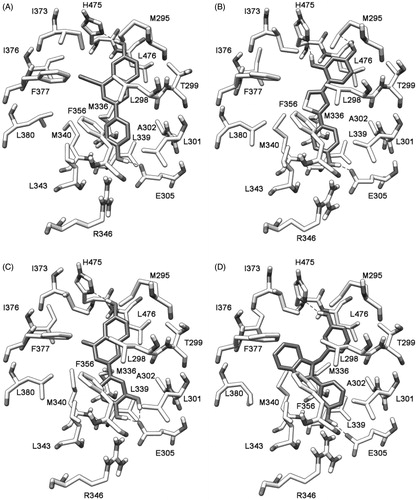
Figure 7. Minimized average structures of compounds 1 (B), 4 (C), and 6 (D) docked into ERβ. The X-ray complex between ERβ and 3-(3-fluoro-4-hydroxyphenyl)-7-hydroxy-1-naphthonitrile (1YYE PDB code) is also reported as a reference system (A).