Figures & data
Figure 1. Malonate (1), 2-methylmalonate (2), 2,2-dichloromalonate (3), 1,2-cyclopropanedicarboxylate (4).
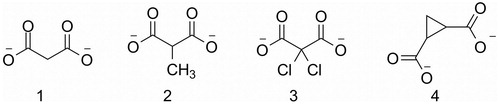
Figure 2. Superposition of malonate (cyan) and cis-1,2-cyclopropanedicarboxylate (green).
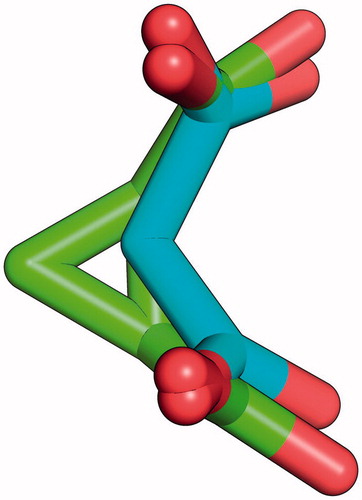
Table 1. Compounds synthesized and tested for SR inhibitory activity.
Table 2. Available SR crystal structures: structural information and water molecules solved in the binding site.
Figure 3. Dissociation constant and half-maximal inhibitory concentration of compound 4. (A) Fluorescence emission spectra, upon excitation at 412 nm, of a solution containing 2.4 μM hSR, 50 mM TEA, 150 mM NaCl, 5 mM TCEP, 1 mM MgCl2, 10% DMSO (v/v), pH 8.0, and increasing concentrations of compound 4, at 20 °C. (B) Dependence on the concentration of compound 4 of the fluorescence emission intensity at 500 nm upon excitation at 412 nm. The experimental points were fitted by a binding isotherm, yielding a KD of 0.90 ± 0.03 mM. (C) Dependence on the concentration of compound 4 of hSR β-elimination activity, at 37 °C. Experiments were carried out in an assay solution containing 0.4 μM hSR, 50 mM TEA, 150 mM NaCl, 36 mM l-Ser, 5 mM DTT, 1 mM MgCl2, 50 μM PLP, 2 mM ATP, 10% DMSO (v/v), pH 8.0, and variable concentrations of compound 4. Experimental data were fitted to the Equation (1), yielding an IC50 value of 3.3 ± 0.4 mM.
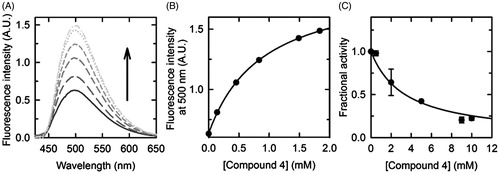
Figure 4. (A) Docking pose of compound 4; (B) binding mode of compound 5: the carboxylic group is located in proximity of a water molecule, that was omitted during docking simulation; (C) pose of compound 8; (D) docking pose of compound 7.
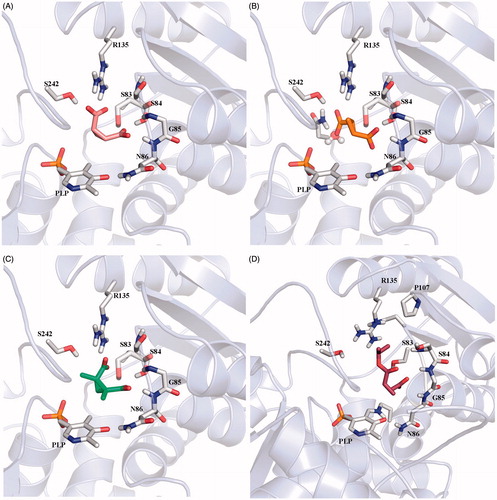
Figure 5. Conserved water molecules in the closed structure of SR. (A) Crystal structure of 3L6B; malonate is depicted in sticks and lemon green, water molecules are reported in ball and sticks. (B) Hbond network between malonate, water molecules and protein residues in the active site of 3L6B crystal structure.
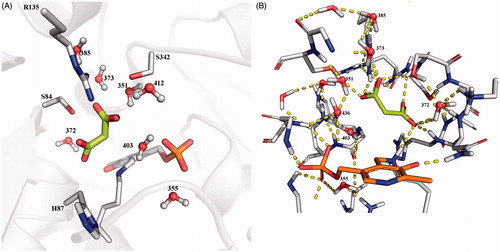
Table 3. Docking experiments performed using the same conditions reported in the paper by Vorlova et al. performed using Glide, PLANTS, and AutoDock.
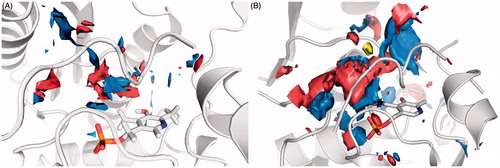
Figure 6. Surface representation of the binding site features map: in blue are reported the Hbond donor areas, in red the Hbond acceptor areas and in yellow the hydrophobic areas. (A) 3L6B crystal structure (closed enzyme conformation). (B) Human model built on the rat 3HMK crystal structure (open enzyme conformation).
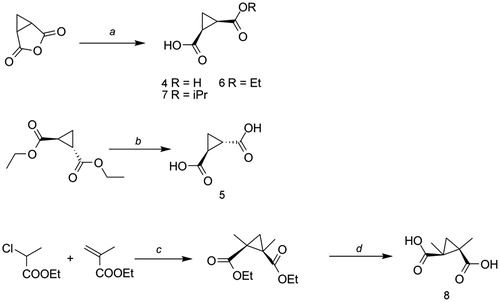
Scheme 1. Reagents and conditions A: (a) for 4, H2O, 2 h at reflux; for 6, EtOH, 2 h at reflux; for 7, iPrOH, 2 h at reflux; (b) 1.KOH, reflux, 2 h; 2.HCl 1N; (c) NaH, toluene, 0 °C to RT, 48–72 h; (d) KOH, THF/water (1:2) from 0 °C to 50 °C, 4 d. Yields and purification methods are reported in the Supplementary information.