Figures & data
Figure 1. 3D model of the audio processor (including digital signal processor, modulator, transmitter coil and retention magnet (not shown), directional microphones, battery, program selector, and volume control), and the bridging bone conductor (including receiver coil, internal retention magnet, demodulator, and transducer).
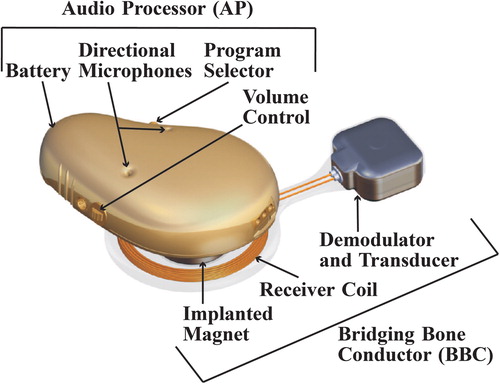
Figure 2. Patient audiograms with air conduction (AC) and masked bone conduction (BC) thresholds. Blue symbols = left; red symbols = right; x = left AC; o = right AC;] = left masked BC; and [= right masked BC. In patients 2 and 4, some BC thresholds were not reached due to over-masking (]] or [[). Pat = patient; R = right; and L = left.
![Figure 2. Patient audiograms with air conduction (AC) and masked bone conduction (BC) thresholds. Blue symbols = left; red symbols = right; x = left AC; o = right AC;] = left masked BC; and [= right masked BC. In patients 2 and 4, some BC thresholds were not reached due to over-masking (]] or [[). Pat = patient; R = right; and L = left.](/cms/asset/c8a11275-ce42-44a8-9edc-2acdf2e28679/iija_a_996826_f0002_oc.jpg)
Table 1. Type of hearing loss, implant side, gender, and age at implantation described for each patient (Uni = unilateral, Bi = bilateral, R = right, L = left, F = female, M = male).
Figure 3. Tone threshold improvements for BCI and reference device, including mean improvement and standard deviation. BCI PTA4 = 31.0 ± 8.0 dB, and Ref PTA4 = 23.7 ± 6.8 dB. Stars are included at frequencies where the BCI has statistically higher improvement than the reference device (α = 0.05).
Table 2. Speech recognition threshold (SRT) and speech recognition score (SRS) improvements for BCI and reference device over the unaided condition for all patients, mean improvement and standard deviation (std).
Figure 4. Signal-to-noise ratio threshold (SNR-threshold) for 50% intelligibility for the BCI, and the reference device for all patients, mean improvement, and standard deviation. BCI SRT-threshold = − 5.5 ± 2.3 dB, and Ref SRT-threshold = − 2.4 ± 3.8 dB.
Figure 5. APHAB improvements in the four categories (ease of communication (EC), listening against background noise (BN), listening under reverberant conditions (RV), and aversiveness of sound (AV)) for the BCI and for the reference device (Ref). Mean improvements (bars) and standard deviations (error bars) are included.
Figure 6. GBI results in the categories total score, general subscale score, social support score, and physical health score. Results for both the BCI and the reference device (Ref) are presented. Mean improvements (bars) and standard deviations (error bars) are included.