Figures & data
Figure 1. Experimental design. GD, gestation day (pregnancy day); PND, post natal day (days after birth); DAE, days after exposure. ‘Time-mated mice’ term was used for all exposed mice during gestation and when referring to results of ‘females’ and ‘dams’ together. Time-mated mice that had not given birth or had only few offspring were termed ‘females’.Time-mated females that gave birth were termed ‘dams’. PND 1 and PND 2 offspring were termed ‘newborns’. Offspring on PND 22–23 was termed ‘offspring at weaning’. Offspring on PND 50 (47) termed ‘adolescents’ had not reached sexual maturity. Time-mated mice were exposed by inhalation and intratracheal instillation to Printex 90. Time-mated mice inhaled 42 mg/m3 Printex 90 or filtered air for 1 hour/day for 11 consecutive days on GD 8–18. The daily dose would correspond to 12 hours at the Danish Occupational Exposure Limit of 3.5 mg/m3for carbon black. The total instilled doses were 0, 11, 54 and 268 μg/animal were distributed over four instillations on GD 7, 10, 15 and 18. The highest dose was chosen as to be similar to the estimated deposited dose in the pulmonary region from the inhalation study.
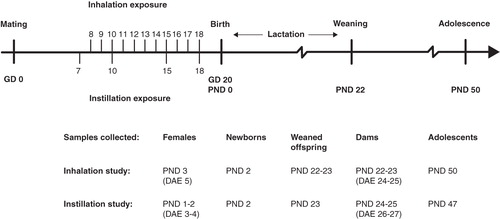
Table I. Key physico-chemical characteristics of Printex 90.
Figure 2. Size distribution data for the inhalation exposure and calculated deposition in mice. (A) Average number size distribution of Printex 90 dust in the inhalation exposure chamber. Error bars are the standard deviation of the different individual exposure runs. (B) Accumulated average number and mass distribution of particles in the exposure chamber. (C) The calculated accumulated particle deposition in the mice using a modified version of the model applied in Jacobsen et al. (Citation2009).
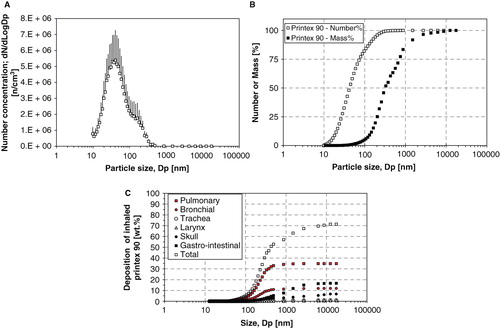
Figure 3. Hydrodynamic size distribution of intratracheally instilled Printex 90 dispersions. Particle size distribution at the three instillation concentrations for the intratracheal instillation exposure measured by Dynamic Light Scattering. Error bars show the standard deviation of six measurements. Inserted table shows the average intensity size and polydispersivity index.
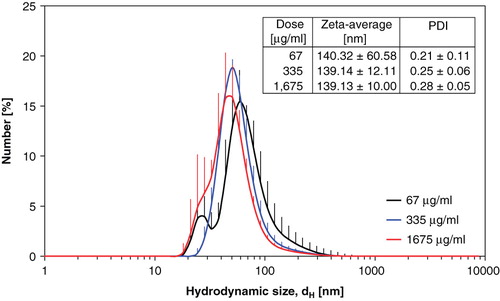
Figure 4. Printex 90 intratracheal instillation exposure characterization by TEM and SEM. (A) Transmission Electron Micrograph of agglomerated small- and medium size Printex 90 aggregates (67 μg/mL). (B) Scanning Electron Micrograph illustrating the overall size and morphologies of Printex 90 aggregates and agglomerates in the dispersions (1.675 μg/mL).
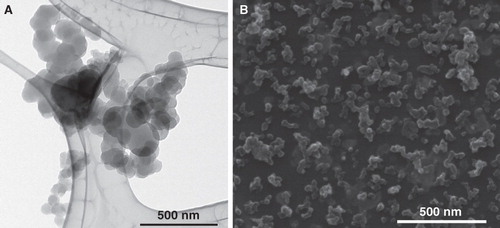
Table II. BAL cell composition of females or dams exposed to Printex 90 by inhalation or intratracheal instillation and control mice.
Table III. Level of DNA strand breaks for females, dams or offspring exposed to Printex 90 by inhalation or intratracheal instillation and control mice.
Table IV. Gestation, lactation and developmental parameters of dams and offspring exposed to Printex 90 by inhalation or intratracheal instillation and control mice.