Figures & data
Figure 1. Graph showing improvement in the KOOS pain subscale with time. Values are mean ± CI. Pairwise comparisons revealed statistically significant improvement between P and all other time points (p<0.001), and between 3 months and 2 years (p = 0.02). P: preoperatively.
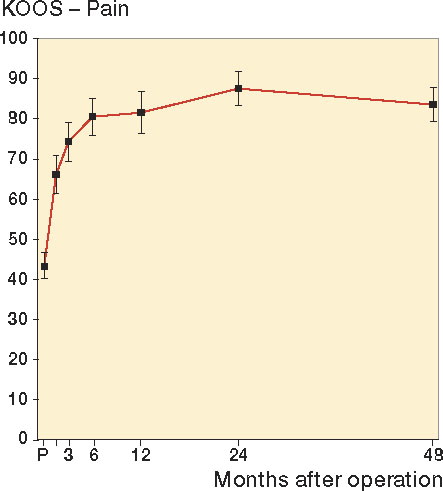
Figure 2. Graph showing improvement in the KOOS ADL subscale with time. Values are mean ± CI. Pairwise comparisons revealed statistically significant improvement between values preoperatively and at all other time points (p < 0.001) and between those at 6 months and 2 years (p = 0.005). Values at 4 years were significantly worse than at 2 years (p < 0.001). See legend to Figure 1 for explanation of abbreviations.
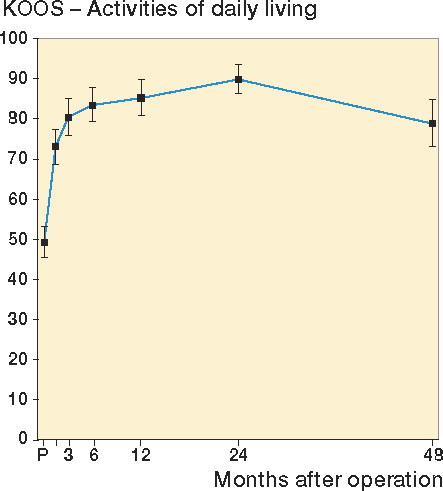
Figure 3. Graph showing improvement in the KOOS symptoms subscale with time. Values are mean ± CI. Pairwise comparisons revealed statistically significant improvement between values preoperatively and at 6m (p < 0.001), between values preoperatively and at 1 year (p < 0.001), between values preoperatively and at 2 years (p < 0.001), between values preoperatively and at 4 years (p < 0.001), and between values at 6 months and 4 years.
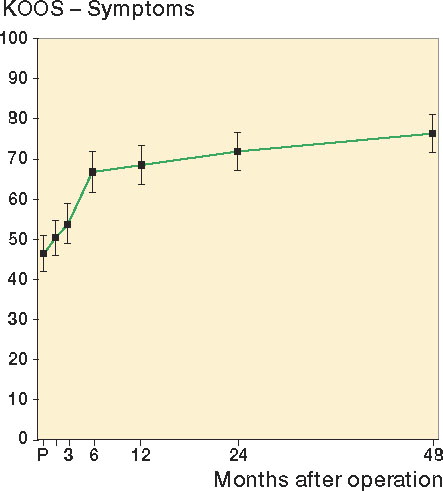
Figure 4. Graph showing improvement in the KOOS QoL subscale with time. Values are mean ± CI. Pairwise comparisons revealed statistically significant improvement between values preoperatively and all other time points (p < 0.001), between values at 3 months and 1 year (p = 0.02), between values at 3 months and 2 years (p < 0.001), and between values at 3 months and 4 years (p < 0.001).
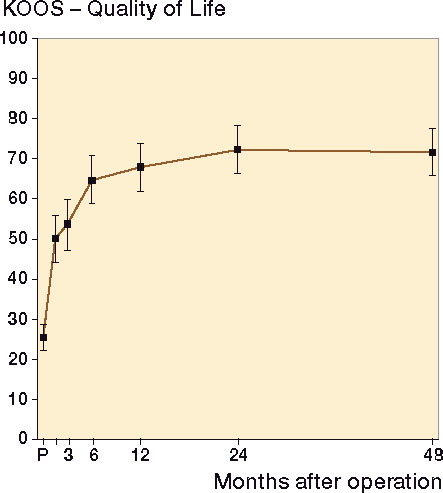
Figure 5. Graph showing improvement in the KOOS sport/rec subscale with time. Values are mean ± CI. Pairwise comparisons revealed statistically significant improvement between values preoperatively and at 6 months (p < 0.001), between values preoperatively and at 1 year (p < 0.001), between values preoperatively and at 2 years (p < 0.001), between values preoperatively and at 4 years (p < 0.001), and between values at 3 months and 6 months (p < 0.001).
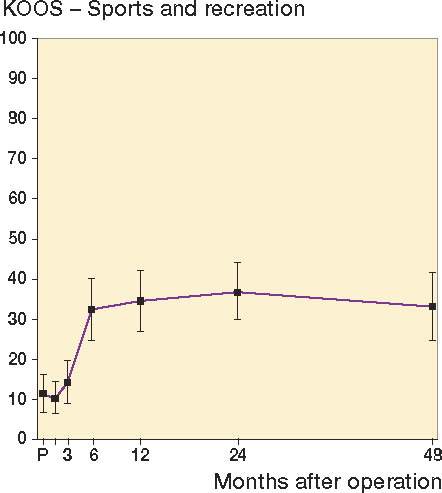
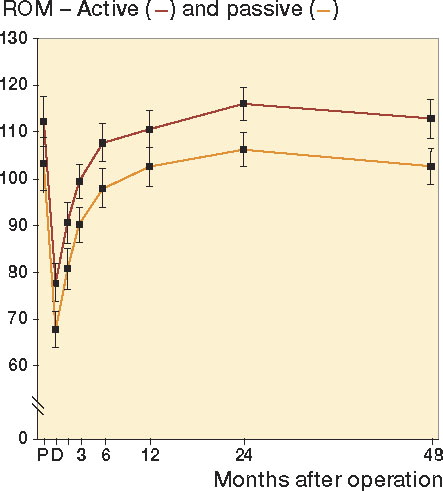
Figure 6. Graph showing improvement in active ROM (red line) and passive ROM (blue line) with time. Values are mean ± CI. Pairwise comparisons for active ROM revealed statistically significant differences between values at discharge from hospital and at all other time points (p < 0.001), between values at 6 months and 1 year (p = 0.004), between values at 6 months and 2 years (p < 0.001), and between values at 6 months and 2 years (p = 0.001). Pairwise comparisons for passive ROM revealed statistically significant differences between values at discharge from hospital and at all other time points (p < 0.001), between values at 6 months and 2 years (p < 0.001), and between values at 1 year and 2 years (p = 0.005). P: preoperatively; D: discharge from hospital.