Figures & data
Figure 1. Improvement with time of KOOS subscales ADL and Pain. Pre = preoperatively. Values are mean and bars represent 95% CI. Pairwise comparisons revealed statistically significant improvement between Pre and all other time points for both subscales (p < 0.001 in both cases), between 6 weeks and 3 months (p < 0.001 in both cases), between 3 months and 6 months (p = 0.03 and p = 0.006), between 3 months and 1 year (p = 0.006 and p < 0.001), and between 3 months and 2 years (p < 0.001 in both cases).
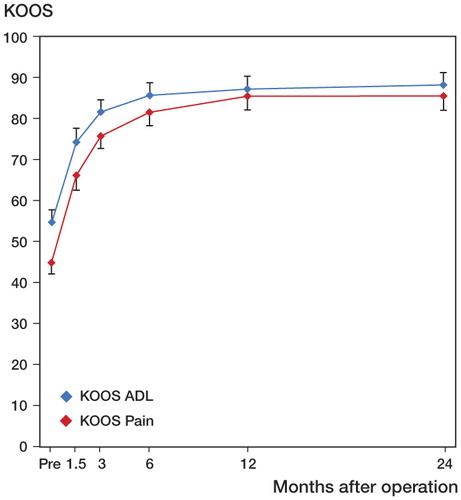
Figure 2. Patients with complete data at 2 years (n = 84) were divided into groups according to the magnitude of the difference between mean preoperative values and mean 2-year values in the KOOS subscales Pain and ADL. Differences of +10 or more score points are better than the suggested minimal perceptible clinical improvement (MPCI) (Roos and Toksvig-Larsen Citation2003).
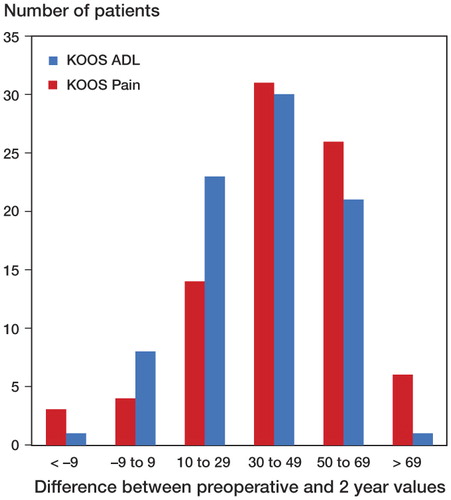
Figure 3. Improvement in KOOS subscales QoL, Symptoms, and Sport/rec with time. Values are mean and bars represent 95% CI. Pairwise comparisons revealed statistically significant improvement between Pre and all other time points (p < 0.001). This was true for all 3 subscales.
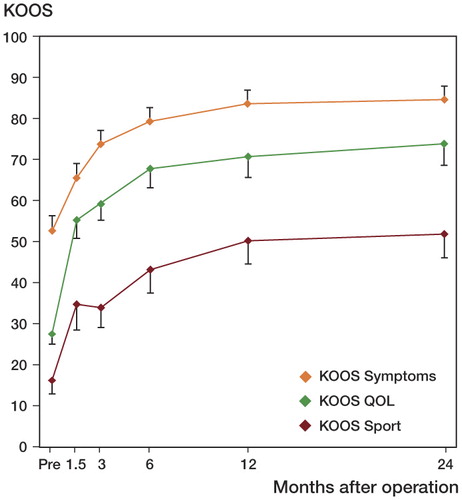
Figure 4. Improvement in Oxford score 0–48 with time. Values are mean and bars represent 95% CI. Pairwise comparisons revealed statistically significant improvement between Pre and all other time points (p < 0.001), between 6 weeks and 3 months (p < 0.001), between 3 months and 6 months (p=0.001), between 3 months and 1 year (p < 0.001), and between 3 months and 2 years (p < 0.001).
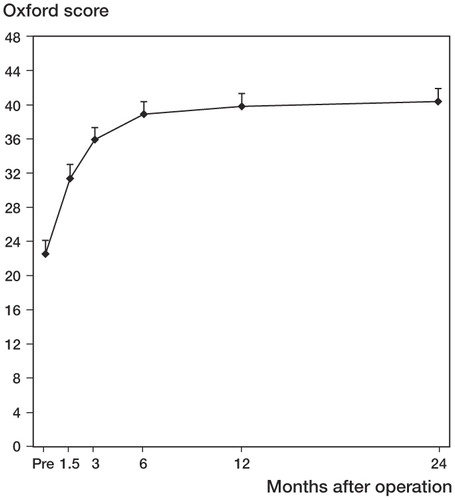
Figure 5. Improvement in UCLA activity score with time. Values are mean and bars represent 95% CI. Pairwise comparisons revealed statistically significant improvement between Pre and all other time points (p < 0.001), except 6 weeks (p = 0.724). There was also statistically significant improvement between 6 weeks and 3 months (p = 0.02), between 6 weeks and 6 months (p < 0.001), and between 3 months and 1 year (p = 0.03).
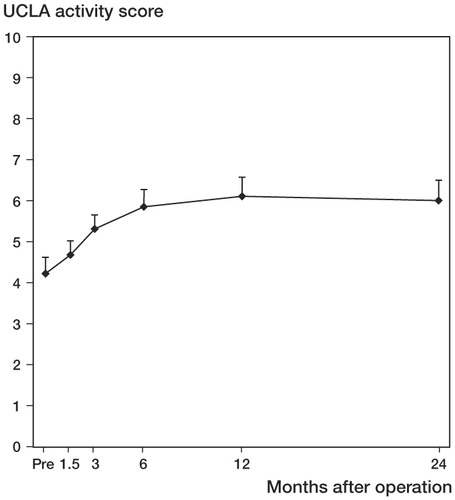
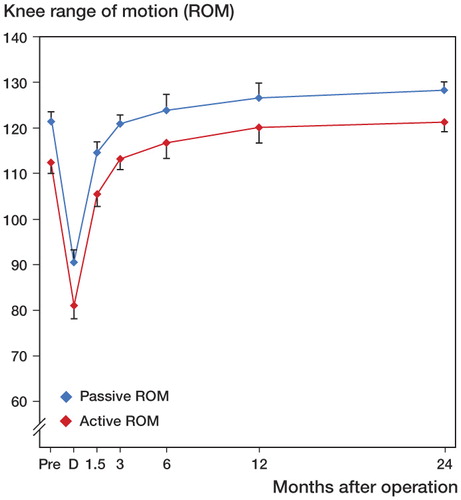
Figure 6. Improvement in active ROM (red line) and passive ROM (blue line) with time. D = discharge from hospital. Values are mean and bars represent 95% CI. Pairwise comparisons for active ROM revealed statistically significant differences between D and all other time points (p < 0.001), between 6 weeks and 3 months (p < 0.001), between 3 months and 1 year (p = 0.006), and between 6 months and 2 years (p = 0.04). For passive ROM, there were significant differences between D and all other time points (p < 0.001), between 6 weeks and 3 months (p < 0.001), between 3 months and 1 year (p = 0.04), and between 3 months and 2 years (p < 0.001).