Figures & data
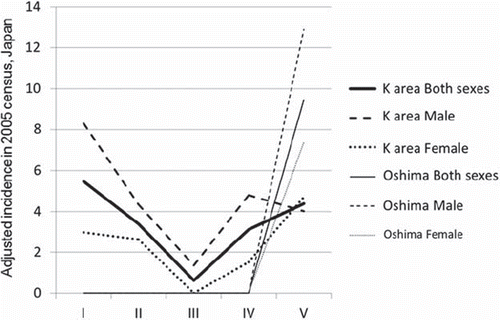
Figure 1. Geography of Koza/Kozagawa/Kushimoto area and Oshima, and distribution of patients with ALS. Patients with ALS between 1960 and 1969 (period I: ), between 1970 and 1979 (period II: Δ): between 1980 and 1989 (period III: □), between 1990 and 1999 (period IV: ☆), and between 2000 and 2009 (period V: ▪) were plotted. *: ALS/PDC
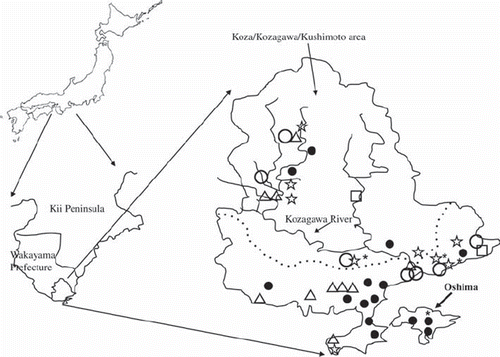
Table I. Patients with ALS in the K. area, including Oshima in each period.
Figure 2. Changes in incidence of ALS in the overall Koza/Kozagawa/Kushimoto (K.) area and Oshima between 1960 and 2009. Comparing the incidence by the periods, the age- and gender-adjusted incidence of ALS in the overall K. area for the 2005 Japanese population was 5.47/100,000 (95% CI 1.86–9.08), male: 8.29/100,000 (95% CI 1.84–14.73), female: 2.98/100,000 (95% CI–0.69–6.66) in period I, markedly decreased to 0.61/100,000 (95% CI–0.28–1.50), male: 1.36/100,000 (95% CI–0.58–3.30), female: 0 in period III, but recently increased again to 4.39/100,000 (95% CI 1.70–7.07), male: 4.01/100,000 (95% CI 0.22–7.81), female: 4.71/100,000 (95% CI 0.93–8.49) in period V.