Figures & data
Figure 1. Particle size distribution, dispersibility, and morphology of Curc-NS. (A) Free curcumin in water. (B) Curc-NS in water. (C) Dynamic light scattering size measurement. (D) SEM images of Curc-NS, and (E) Magnification of (D).
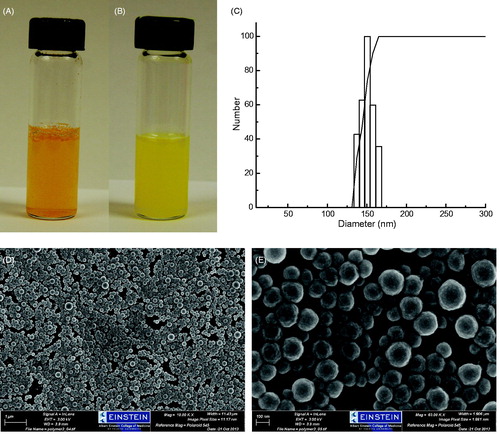
Figure 2. UV-vis absorbance spectra of cucumin. (A) Free curcumin in acetone at 6 μg/mL, (B) Curc-NS in water at 15 μg/mL, (C) Control-NS in acetone at 1 mg/mL.
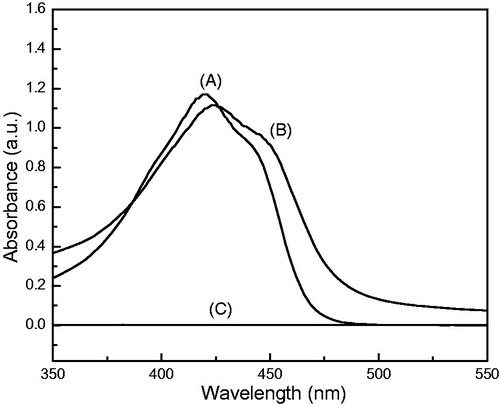
Figure 3. Curcumin release profile of Curc-NS. (A) Stability of free curcumin in PBS at 37 °C. (B) Release of curcumin from Curc-NS in PBS at 37 °C. Data are presented as mean ± standard error of experiments performed in triplicate.
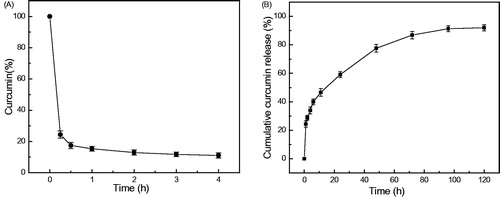
Figure 4. Cellular uptake of Curc-NS. Fluorescence microscopic images of HeLa cells treated with (A) Curc-NS, (B) Control-NS, and MDA-MB-231 cells treated with (C) Curc-NS, (D) Control-NS.
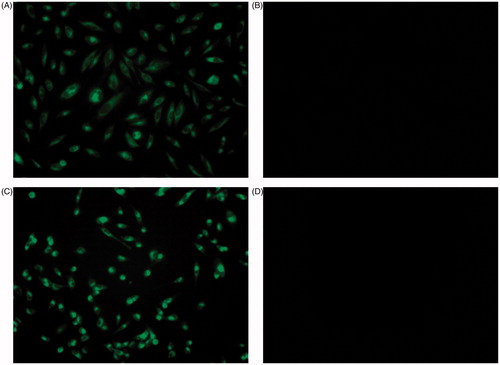
Figure 5. Cytotoxicity of free curcumin and Curc-NS. Cell viability of (A) Hela cells and (B) MDA-MB-231 cells exposed to different concentration of free curcumin (open bars) and Curc-NS (filled bars). Data are presented as mean and standard deviations of six repeats of each treatment group (P < 0.05).
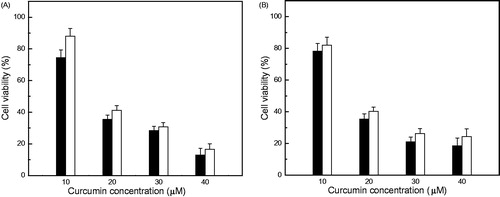
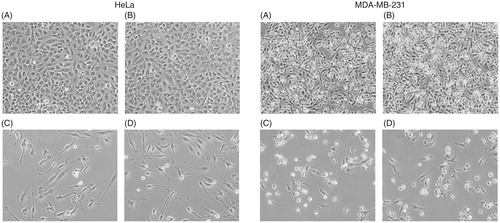
Figure 6. Phase contract microscopic images showing cytotoxicity of free curcumin and Curc-NS. HeLa and MDA-MB-231 cells treated with (A) 0.1% DMSO, (B) Control-NS, (C) 30 μM free curcumin, and (D) Curc-NS containing 30 μM curcumin.