Figures & data
Figure 1. Kainate-hypoxia treatment induces neuronal death. (A) KaHx induces neuronal death as shown morphologically in brightfield images or by combined propidium iodide (PI)-staining (red, dead cells) and MAP2-immunolabeling (green) 6 h after control and KaHx stimulations. (B) Representative images of PI-stained (red) and Hoechst-stained nuclei (blue, total cells) of cultured cortical neurons 6 h following 30 min of different stimulations: ct, control; KaHx, kainate-hypoxia; Ka, kainate; Hx, hypoxia. (C) Quantification of PI-positive nuclei as a percentage of all nuclei showing a rapid and strong cell death induced by the combination of kainate and hypoxia whereas the separate treatments were not toxic (ct: 5 ± 2%, KaHx 3 h: 44 ± 6%, KaHx 6 h: 59 ± 3%, Ka: 11 ± 2%, Hx 6 ± 2%). Values are mean ± SEM, *P < 0.05, ***P < 0.001, Tukey-Kramer test. n = 6 independent experiments. Scale bar: 20 µm.
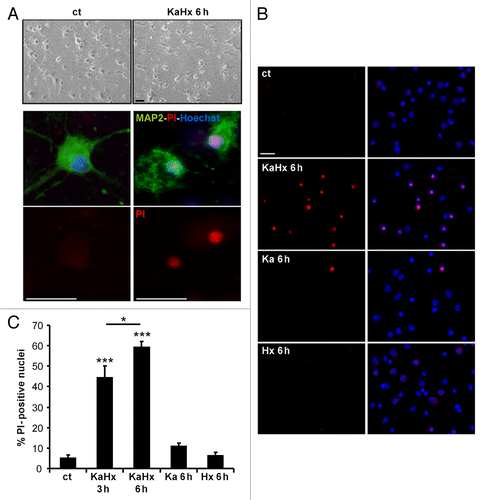
Figure 2. Kainate-hypoxia increases autophagosome formation and lysosomal markers in cultured cortical neurons. (A) Representative immunoblot of LC3 (upper part) and the corresponding quantification (lower part) showing that the LC3-II expression level is upregulated at 3 h and 6 h after kainate-hypoxia (KaHx) stimulation. (ct: 100 ± 0%, KaHx 3 h: 160 ± 8%, KaHx 6 h: 185 ± 19%). Values are mean ± SEM, ***P < 0.001, Steel-Dwass test. (B) Confocal images of LC3 immunolabeling (in red) of representative cultured cortical neurons at 6 h after control (ct) or KaHx stimulation (upper part), and quantification of LC3-positive dots per neuron per µm2 (lower part) demonstrating a strong increase in the number of autophagosomes after KaHx. (ct: 0.028 ± 0.004, KaHx 3 h: 0.189 ± 0.022, KaHx 6 h: 0.224 ± 0.024). Values are mean ± SEM, Tukey-Kramer test. Scale bar: 20 µm. (C) Immunolabeling for the lysosomal marker LAMP1 (green) shows an increase not only in the number of positive dots (upper graph; ct: 0.099 ± 0.006, KaHx 3 h: 0.196 ± 0.009, KaHx 6 h: 0.210 ± 0.017; Tukey-Kramer test) but also in the percentage of large positive dots (> 0.5 μm2) (lower graph; ct: 3.3 ± 1.5%, KaHx 3 h: 23.9 ± 3%, KaHx 6 h: 20 ± 4.8%; Steel-Dwass test) after KaHx. Values are mean ± SEM (D) Similar results are obtained with immunolabeling for the lysosomal enzyme CTSB (red). This phenomenon occurs in neurons as shown by double immunolabeling for CTSB and RBFOX3 (green). (Upper graph: ct: 0.06 ± 0.01, 3 h KaHx: 0.176 ± 0.02, 6 h KaHx: 0.19 ± 0.02; lower graph: ct: 3.4 ± 1.2%, 3 h KaHx: 16.1 ± 1.2%, 6 h KaHx: 16.9 ± 1.7.) Values are mean ± SEM, Steel-Dwass test. n ≥ 25. Scale bar: 20 µm. *P < 0.05, **P < 0.01, ***P < 0.001. n = 4 independent experiments.
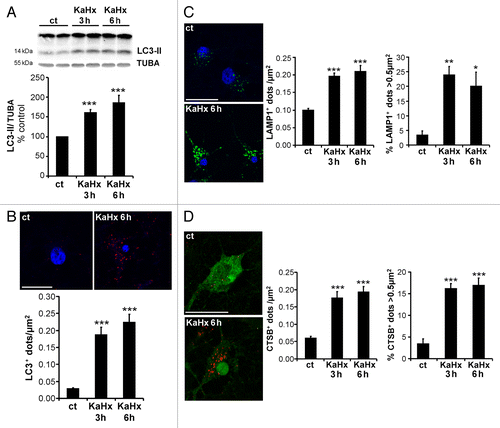
Figure 3. Kainate-hypoxia enhances autophagic flux in cultured cortical neurons. (A) Representative immunoblots for SQSTM1 (upper part) and the corresponding quantification (lower part) indicate that kainate-hypoxia (KaHx) significantly decreases SQSTM1 expression. (ct: 100 ± 0%, 3 h KaHx: 76 ± 4%, 6 h KaHx: 73 ± 5%). n = 13 independent experiments. (B) Representative immunoblots against LC3 and SQSTM1 and the corresponding quantifications demonstrate that exposure to pepstatin A (PepA) and E64 in cultured neurons increases the level of LC3-II (Pep/E64: 174 ± 13%) and SQSTM1 (Pep/E64: 144 ± 14%) relative to control (ct) stimulation, indicating that autophagic degradation is prevented. Addition of Pep/E64 6 h before, during or after KaHx treatment (6 h) results in a greater increase in LC3-II than treatment with KaHx or E64/PepA alone (Ka+Hx: 169 ± 5%, E64/PepA + KaHx: 277 ± 27%) and diminishes the KaHx-induced degradation of SQSTM1 (Ka+Hx: 78 ± 3%, E64/PepA + KaHx: 118 ± 9%). Values are mean ± SEM, *P < 0.05, **P < 0.01, ***P < 0.001, Tukey-Kramer test. n = 4 independent experiments. (C) Confocal images of representative cultured cortical neurons transfected with the tandem mRFP-GFP-LC3–expressing plasmid at 3 h and 6 h after Ka/Hx. (D) Quantification of the number of LC3-positive dots per neuron per µm2 shows an active autophagic flux (TOTAL = GFP+ RFP+ and GFP- RFP+: ct: 0.03 ± 0%, 3 h: 0.17 ± 0.02%, 6 h: 0.23 ± 0.01%; early autophagosomes = GFP+ RFP+: ct: 0.01 ± 0%, 3 h: 0.10 ± 0.02%, 6 h: 0.13 ± 0.01%; autolysosomes = GFP- RFP+: ct: 0.02 ± 0%, 3 h: 0.07 ± 0.01%, 6 h: 0.10 ± 0.01%). Values are mean ± SEM,. **P < 0.01, ***P < 0.001. Tukey-Kramer test. n = 4 independent experiments. Scale bar: 20 µm.
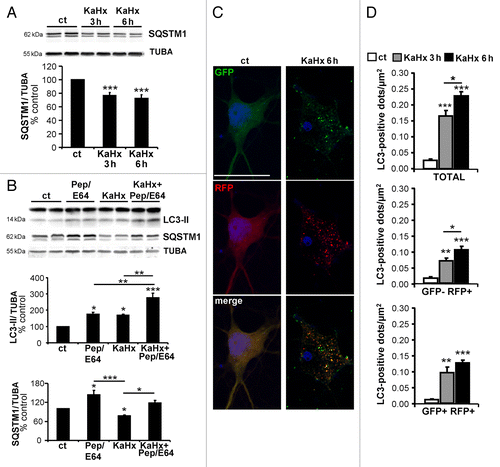
Figure 4. Pharmacological inhibition of the autophagic process with 3-methyladenine or E64/pepstatinA protects cultured cortical neurons against kainate-hypoxia treatment. (A) Representative immunoblots against LC3 and SQSTM1 and the corresponding quantifications confirm that 3-methyladenine (3-MA) prevents accumulation of LC3-II (KaHx: 164 ± 14%, 3-MA KaHx: 95 ± 14; Welch ANOVA, n = 5 independent experiments) and reduction of SQSTM1 (KaHx: 65 ± 8%, 3-MA KaHx: 110 ± 12%; Welch ANOVA, n = 5 independent experiments) following exposure to KaHx. (B and C) Quantification of PI-positive nuclei as a percentage of all nuclei (Hoechst-stained) demonstrates that inhibition of the autophagic process with (B) 3-MA (ct: 6.6 ± 1.4, 3-MA: 8.4 ± 1.9, KaHx: 54.8 ± 2, 3-MA KaHx: 24.6 ± 4.8, Steel-Dwass test, n = 3 independent experiments) or (C) E64/PepstatinA (PepA) (ct: 7.9 ± 0.1, E64/PepA: 12.5 ± 1, KaHx: 60 ± 3.8, E64/PepA KaHx: 26.7 ± 7.4, Tukey-Kramer test, n = 4 independent experiments) is neuroprotective. Values are mean ± SEM, *P < 0.05, **P < 0.01, ***P < 0.001.
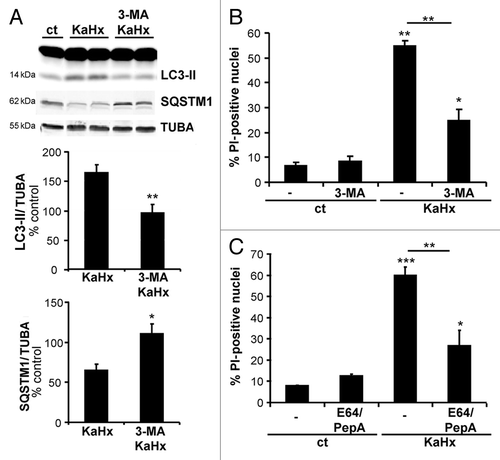
Figure 5. Inhibition of autophagy by downregulation of ATG7 or BECN1 protects cultured cortical neurons against kainate-hypoxia treatment. (A and B) Representative immunoblots and corresponding quantifications showing that lentiviral transduction of shRNAs against (A) Atg7 or (B) Becn1 reduces the expression of ATG7 (53 ± 2%) or BECN1 (43 ± 2%), respectively, compared with control vector-transduced neurons. Values are mean ± SEM, ***P < 0.001, Wilcoxon test. n = 4 independent experiments. (C and D) Downregulation of ATG7 or BECN1 inhibits autophagy induced 6 h after KaHx. (C) ATG7 downregulation significantly reduces LC3-II (control vector KaHx: 163 ± 30%, Atg7 shRNA KaHx: 68 ± 10%, Kruskal-Wallis test, n = 6 independent experiments) as occurs to a lesser extent with (D) BECN1 downregulation (control vector KaHx: 205 ± 22%, Becn1 shRNA KaHx: 140 ± 15%, ANOVA, n = 5 independent experiments). Knockdown of either protein is however enough to completely block SQSTM1 degradation following KaHx (for ATG7: control vector KaHx: 81 ± 2%, Atg7 shRNA KaHx: 116 ± 12%, n = 5 independent experiments; for BECN1: control vector KaHx: 82 ± 4%, Becn1 shRNA KaHx: 123 ± 7%, Welch ANOVA, n = 7 independent experiments). Values are mean ± SEM expressed as a percentage of control (ct)-stimulated neurons transduced with control vector, **P < 0.01, ***P < 0.001. (E and F) Transduced neurons with Atg7 and Becn1 shRNAs are less sensitive to KaHx than control vector-transduced neurons as demonstrated by a significant decreased number of PI-positive nuclei 6 h after the stimulation (for ATG7: control vector: 2 ± 0.7%, Atg7 shRNA: 5 ± 2%, control vector KaHx: 62 ± 2%, Atg7 shRNA KaHx: 46 ± 3%; for BECN1: control vector: 2 ± 0.8%, Becn1 shRNA: 5 ± 1%, control vector KaHx: 59 ± 2%, Becn1 shRNA KaHx: 30 ± 4%). Values are mean ± SEM expressed as a percentage of all nuclei (Hoechst-stained). **P < 0.01, Steel-Dwass test, n = 8 independent experiments.
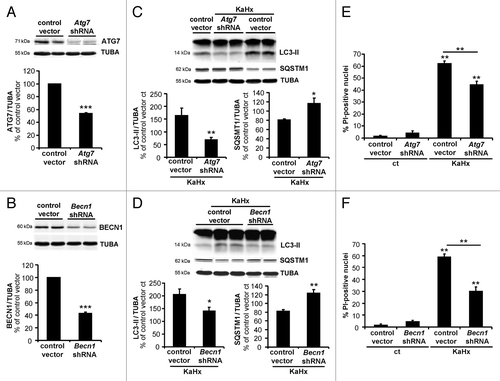
Figure 6. Upregulation of autophagy by overexpression of ATG7 and BECN1 sensitizes cultured cortical neurons against kainate-hypoxia treatment. (A and B) Representative immunoblots and corresponding quantifications showing that lentiviral transduction of (A) ATG7-myc and (B) BECN1-myc strongly increase expression of ATG7 (430 ± 32%) and BECN1 (220 ± 20%) compared with control vector transduced neurons. Values are mean ± SEM, Wilcoxon test. n = 4 independent experiments. (C) The very strong overexpression of ATG7 enhances the autophagic process induced 3 h after KaHx as demonstrated by an increase in LC3-II (control vector KaHx: 139 ± 3%, ATG7-myc KaHx: 189 ± 15%, Kruskal-Wallis test, n = 6 independent experiments) and by a reduction of SQSTM1 (control vector KaHx: 83 ± 1%, ATG7-myc KaHx: 65 ± 5%, Welch ANOVA, n = 5 independent experiments). (D) The 2-fold increase in BECN1 expression significantly increases the level of LC3-II (control vector KaHx: 134 ± 2%, BECN1-myc KaHx: 156 ± 7%, Welch ANOVA, n = 4 independent experiments) and decreases the level of SQSTM1 (control vector KaHx: 81 ± 2%, BECN1-myc KaHx: 72 ± 5%, Kruskal-Wallis test, n = 6 independent experiments) 3 h after KaHx. Values for (C and D) are mean ± SEM expressed as a percentage of control (ct)-stimulated neurons transduced with control vector. (E and F) Neurons transduced with ATG7-myc and BECN1-myc expression vectors are more sensitive to KaHx than control vector-transduced neurons as is demonstrated by a significantly increased number of PI-positive nuclei 3 h after the treatment (for ATG7: control vector: 2.6 ± 0.6%, ATG7-myc: 2.5 ± 1.1%, control vector KaHx: 43.3 ± 2.8%, ATG7-myc KaHx: 59.1 ± 3.3%, Steel-Dwass test; for BECN1: control vector: 2.6 ± 0.6%, BECN1-myc: 3.2 ± 1.2%, control vector KaHx: 43.3 ± 2.8%, BECN1-myc KaHx: 56.8 ± 5.4%, Tukey-Kramer test). Values are mean ± SEM expressed as a percentage of all nuclei (Hoechst-stained). n = 4 independent experiments. *P < 0.05, **P < 0.01, ***P < 0.001.
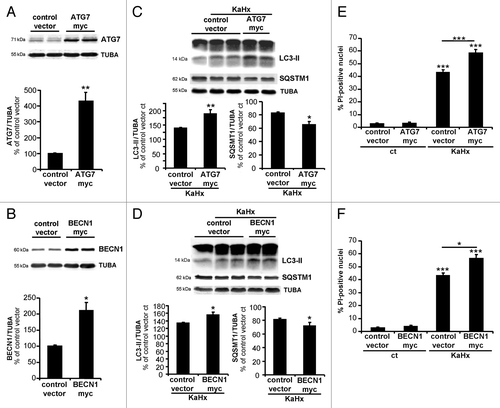
Figure 7. Neuronal autophagy is enhanced in the striatum after neonatal cerebral hypoxia-ischemia. Cerebral hypoxia-ischemia (HI) increased the presence of neuronal autophagosomes in the striatum of 7-d old rats 24 h after HI as shown by (A) a higher level of LC3-II in immunoblots (sh: 100 ± 0%, 6 h: 121 ± 8%, n = 7 rats, 24 h: 166 ± 13%, n = 12 rats, Tukey-Kramer test) and (B) by strong punctate LC3-immunolabeling (arrows) in RBFOX3-positive neurons compared with sham-operated animals (sh). Scale bar: 20 µm. (C) Quantification of SQSTM1 expression level by immunoblot shows that neonatal HI induces SQSTM1 degradation (sh: 100 ± 4%, 24 h: 60 ± 7%, n = 8 rats, Welch ANOVA). Values are expressed as a percentage of sham-operated controls. (D) Neonatal cerebral HI increases β-hexosaminidase staining at 24 h compared with sham operated animals. Scale bar: 10 µm.
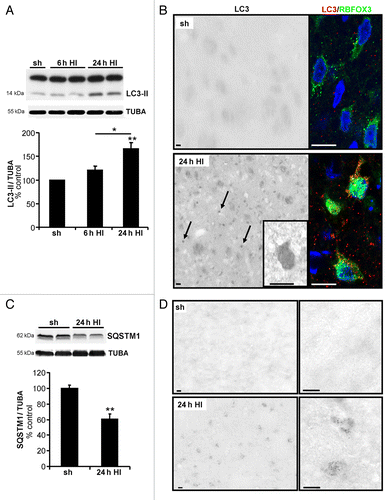
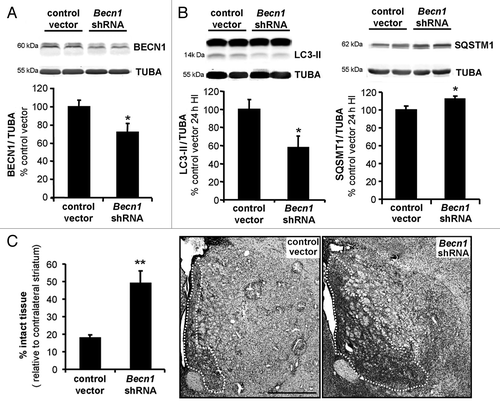
Figure 8. Inhibition of autophagy by lentiviral vectors expressing shRNA targeting Becn1 reduces brain damage following neonatal cerebral hypoxia-ischemia. (A) Representative immunoblot and corresponding quantification showing that lentiviral injections mediating Becn1 downregulation decreased BECN1 expression levels by 30% compared with control lentiviral vector injections (control vector: 100 ± 7%, Becn1 shRNA: 72 ± 10%), Welch ANOVA, n = 4 rats). When subjected to HI, animals injected with shRNA against Becn1 present (B) a reduced induction of LC3-II expression 24 h after the insult (control vector: 100 ± 10, Becn1 shRNA: 56 ± 12%, Welch ANOVA, n = 6 rats) and a decreased SQSTM1 degradation (control vector: 100 ± 4, Becn1 shRNA: 112 ± 3%, Welch ANOVA, n = 8 rats). (C) Rat pups with striatal injection of Becn1 shRNA show a higher percentage of “intact striatum,” meaning surviving or noninfarcted striatum, than do those with control vector-injection (control vector: 18 ± 2%, n = 15; Becn1 shRNA: 49 ± 7%, n = 12, Welch ANOVA). Values are mean ± SEM *P < 0.05, **P < 0.01. Scale bar: 1 mm.