1,117
Views
18
CrossRef citations to date
0
Altmetric
Review

Receptor protein tyrosine phosphatases and cancer

New insights from structural biology

, &
Pages 356-364 | Received 07 May 2012, Accepted 22 Jun 2012, Published online: 01 Jul 2012

Figures & data

Figure 1. Architecture of selected human receptor protein tyrosine phosphatases considered in this review. The intracellular regions are composed of two tyrosine phosphatase domains called D1 and D2. D1 is catalytically active whereas D2 is not. MAM, Meprin-A5-RPTPμ domain; Ig, Immunoglobulin-like domain; FNIII, fibronectin type III domain; CA, Carbonic anhydrase domain; D1, active protein tyrosine phosphatase domain; D2, inactive protein tyrosine phosphatase domain.
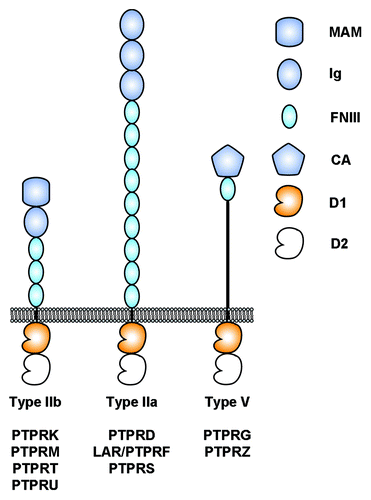
Figure 1. Architecture of selected human receptor protein tyrosine phosphatases considered in this review. The intracellular regions are composed of two tyrosine phosphatase domains called D1 and D2. D1 is catalytically active whereas D2 is not. MAM, Meprin-A5-RPTPμ domain; Ig, Immunoglobulin-like domain; FNIII, fibronectin type III domain; CA, Carbonic anhydrase domain; D1, active protein tyrosine phosphatase domain; D2, inactive protein tyrosine phosphatase domain.

Figure 2. Overview of somatic mutations in type IIb RPTPs shown in the PTPRM homophilic dimer. The structure of the PTPRM homodimer was obtained from PDB ID 2V5Y determined by Aricescu et al.Citation37 and is shown as a ribbon diagram. The MAM and Ig region are colored slate and the FNIII modules are colored cyan. The residues that are mutated in cancers are shown as spheres colored based on the predicted effects of the location of the mutations (yellow, buried; green, interdomain interface; red, homophilic interface; white, solvent exposed). The expected effect of the mutations in yellow, green or red would be to impair homophilic interactions whereas the expected effects of mutating residues shown as white spheres are unknown.
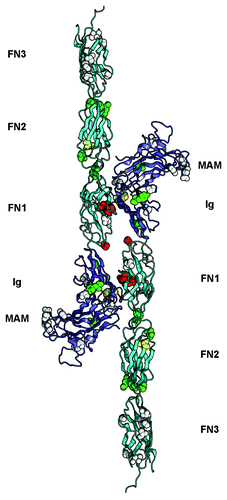
Figure 2. Overview of somatic mutations in type IIb RPTPs shown in the PTPRM homophilic dimer. The structure of the PTPRM homodimer was obtained from PDB ID 2V5Y determined by Aricescu et al.Citation37 and is shown as a ribbon diagram. The MAM and Ig region are colored slate and the FNIII modules are colored cyan. The residues that are mutated in cancers are shown as spheres colored based on the predicted effects of the location of the mutations (yellow, buried; green, interdomain interface; red, homophilic interface; white, solvent exposed). The expected effect of the mutations in yellow, green or red would be to impair homophilic interactions whereas the expected effects of mutating residues shown as white spheres are unknown.

Figure 3. Somatic mutations identified in the Ig1-Ig2 tandem repeats of type IIa RPTPs. Mutations in LAR, PTPRD and PTPRS are shown on the structure of human LAR bound to the glycosaminoglycan mimic sucrose octasulfate (PDB ID 2YD8Citation69). The sucrose octasulfate is shown in ball-and-stick representation. The residues that are mutated in cancers are shown as spheres colored based on the predicted effects of the location of the mutations (yellow, buried; green, interdomain interface; red, ligand interface; white, solvent exposed). The expected effect of the mutations in yellow would be to disrupt the folding of the Ig domain while mutation of the residues colored green is expected to disrupt the interface between Ig1 and Ig2. Introducing a glycine to glutamate change at position 61 (shown in red in the structure) is expected to impair interactions with the ligand. The potential effects of mutating residues colored white are unknown.
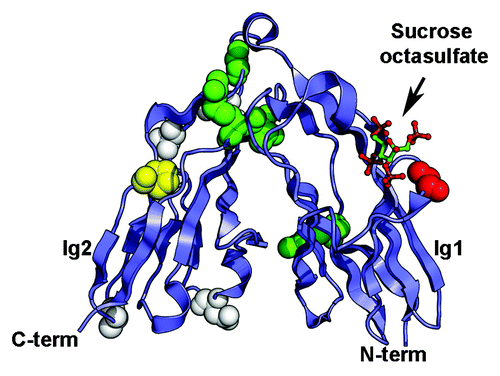
Figure 3. Somatic mutations identified in the Ig1-Ig2 tandem repeats of type IIa RPTPs. Mutations in LAR, PTPRD and PTPRS are shown on the structure of human LAR bound to the glycosaminoglycan mimic sucrose octasulfate (PDB ID 2YD8Citation69). The sucrose octasulfate is shown in ball-and-stick representation. The residues that are mutated in cancers are shown as spheres colored based on the predicted effects of the location of the mutations (yellow, buried; green, interdomain interface; red, ligand interface; white, solvent exposed). The expected effect of the mutations in yellow would be to disrupt the folding of the Ig domain while mutation of the residues colored green is expected to disrupt the interface between Ig1 and Ig2. Introducing a glycine to glutamate change at position 61 (shown in red in the structure) is expected to impair interactions with the ligand. The potential effects of mutating residues colored white are unknown.

Figure 4. Dimerization of the tandem phosphatase regions of PTPRG. The antiparallel dimer of the tandem phosphatase region of PTPRG (PDB ID 2NLKCitation110) is shown as a ribbon diagram. The catalytically active D1 domains are colored orange, while the inactive D2 domains are colored white. Dimerization blocks access to a key cysteine residue in the active site (depicted as green spheres).
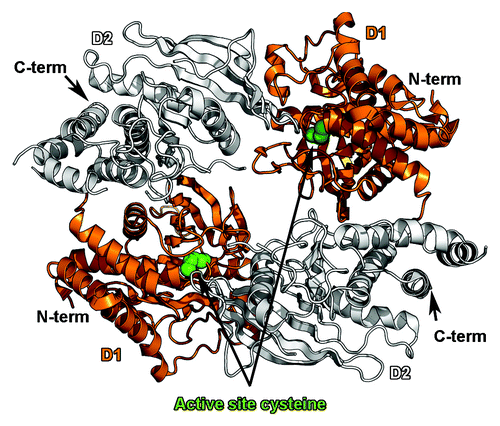
Figure 4. Dimerization of the tandem phosphatase regions of PTPRG. The antiparallel dimer of the tandem phosphatase region of PTPRG (PDB ID 2NLKCitation110) is shown as a ribbon diagram. The catalytically active D1 domains are colored orange, while the inactive D2 domains are colored white. Dimerization blocks access to a key cysteine residue in the active site (depicted as green spheres).

Reprints and Corporate Permissions

Please note: Selecting permissions does not provide access to the full text of the article, please see our help page How do I view content?

To request a reprint or corporate permissions for this article, please click on the relevant link below:

Academic Permissions

Please note: Selecting permissions does not provide access to the full text of the article, please see our help page How do I view content?

Obtain permissions instantly via Rightslink by clicking on the button below:

If you are unable to obtain permissions via Rightslink, please complete and submit this Permissions form. For more information, please visit our Permissions help page.