
 ?Mathematical formulae have been encoded as MathML and are displayed in this HTML version using MathJax in order to improve their display. Uncheck the box to turn MathJax off. This feature requires Javascript. Click on a formula to zoom.
ABSTRACT
To establish if highly eutrophic lakes generate higher N2O emissions than non-eutrophic aquatic environments in New Zealand, we monitored N2O emissions from hypereutrophic Lake Horowhenua, near Levin, and the oligotrophic Turitea dam reservoir, near Palmerston North, used as control. Based on more than 12 months of monitoring data, N2O emissions from Lake Horowhenua were estimated to −0.05–6.93 mg-N2O·m−2·d−1 (n = 66), with a median of 0.30 mg-N2O·m−2·d−1. At the Turitea reservoir, N2O emissions ranged from −0.02–1.51 mg-N2O·m−2·d−1 with a median of 0.15 mg-N2O·m−2·d−1 (n = 53). No correlation was found between N2O emissions and the water temperature, sunlight, dissolved oxygen, nutrient concentration or chlorophyll a. When extrapolating the emission data to NZ, we estimated NZ lakes could release 83 kt of N2O as CO2eq each year, which is low in comparison to other sectors such as agriculture. Following the Intergovernmental Panel on Climate Change methodology, the N2O emission factor for Lake Horowhenua was estimated at 0.0019 kg N2O-N per kg of N-NO3− input into the lake.
Introduction
The introduction of nitrogen and phosphorus in water bodies can cause the excessive growth of primary producers such as microalgae (Conley et al. Citation2009; DelSontro et al. Citation2018; Plouviez et al. Citation2021). This phenomenon, known as eutrophication, affects water ecosystems globally (e.g. 30–40% of lakes, Yang et al. Citation2008). When actively growing, microalgae blooms can harm the ecosystem by producing toxins, preventing light penetration, and reducing water quality (Xu et al. Citation2010). When dying, the microalgae biomass is decomposed by microbes severely depleting dissolved oxygen to levels that cannot support most life (Jenny et al. Citation2016). New Zealand (NZ) is not exempt from this issue as the NZ Ministry for the Environment (MfE) estimated that 46% of the 3802 NZ lakes larger than 1 ha were eutrophic in 2020 (MfE and Stats NZ Citation2020).
Another consequence of eutrophication is the emission of nitrous oxide (N2O; Teuma et al. Citation2023), a potent greenhouse gas (GHG) and ozone-depleting atmospheric pollutant (Ravishankara et al. Citation2009). Several authors have indeed estimated that global N2O emissions from eutrophic lakes could represent 52–211 Mt CO2.year−1 (DelSontro et al. Citation2018; Plouviez et al. Citation2019b; Plouviez and Guieysse Citation2020), which represents 3–12% of all direct anthropogenic N2O emissions from agriculture, the largest contributor to anthropogenic N2O emissions globally (Tian et al. Citation2020). Many studies have also reported high N2O emissions from eutrophic aquatic environments that could not be explained by bacterial mechanisms (Plouviez et al. Citation2019b). Acknowledging that high N2O emissions have often been recorded from ‘nutrient-impacted waters such as eutrophic lakes’, the Intergovernmental Panel on Climate Change (IPCC) recently increased the value of the Tier 3 emission factor used to compute N2O emissions from wastewater treatment discharge into nutrient-impacted waters from 0.005 to 0.019 kg N2O-N emitted per kg of N received (Bartram et al. Citation2019).
This research therefore sought to establish, for the first time, if New Zealand eutrophic lakes can generate higher N2O emissions than aquatic ecosystems not impacted by eutrophication.
Material and methods
Sampling sites
Lake Horowhenua and the Turitea drinking water reservoir were selected based on their trophic state history using data from Horizons Regional Council (https://www.lawa.org.nz), the Ministry for the Environment (https://data.mfe.govt.nz), and the literature (Wood et al. Citation2017).
Over 12 months, Lake Horowhenua was monitored weekly at 5 and 15 m from the shore (∼0.1–1 m depth, muddy bottom, Figure S1A) and the Turitea reservoir was weekly monitored at 2 locations 5 m from the shore (∼1.5 m depth, rocky bottom, Figure S1B).
Monitoring
Dissolved oxygen (DO) concentration, pH, conductivity, and water temperature were measured on site using a multisensor equipped with multi-probes (Orion™ Star A329, Orion™ 4-Electrode Conductivity Cell, Thermo Scientific; Orion™ RDO™ Dissolved Oxygen Probe, Thermo Scientific; Orion™ ROSS Ultra™ Low Maintenance Triode™ pH/ATC electrode, Thermo Scientific). Surface (0–0.10 m) water samples (>500 mL) were collected and immediately kept on ice in darkness to later measure the concentrations of chlorophyll, total suspended solids (TSS), nitrate, nitrite, and phosphate in the laboratory. To quantify dissolved N2O concentration, duplicates of 6 mL surface water samples were collected with a syringe (no air contact) and immediately injected into 12 mL vials (Labco Exetainer® 12 ml Vial, Lampeter, UK) previously flushed with dinitrogen gas and supplied 200 µL of a 50% w/v solution of zinc chloride to inhibit metabolic activity (Plouviez et al. Citation2019a). Further details of the analyses performed can be found in S2.
Air temperature, solar irradiance, and wind speed were obtained from the New Zealand Institute of Water and Atmospheric research (NIWA, http://cliflo.niwa.co.nz/; Station: Levin Ews, Levin; Palmerston North Ews, Palmerston North).
N2O emission fluxes
N2O emissions were computed as described by Xiao et al. (Citation2018) using Equation (1):
(1)
(1) Where
represents the N2O transfer rate across the water surface (mol·m−2·d−1), [i]* represents the dissolved concentration of N2O at equilibrium with the atmosphere (mol·mwater−3), and
is the mass transfer coefficient of N2O (m·d−1).
The field value of was estimated from the mass transfer coefficient for oxygen at 20°C and corrected for temperature based on the diffusivities of the gases (N2O and O2) and a temperature correction factor of 1.024 (Equation (2), Plouviez et al. Citation2019a):
(2)
(2) Where
is the O2 mass transfer coefficient (m·d−1),
is the molecular diffusion coefficients of N2O in water at 20°C (1.84·10−9 m−2·s−1 for N2O) and
is the molecular diffusion coefficient of O2 in water at 20°C (1.98·10−9 m−2·s−1) (Plouviez et al. Citation2019a).
The field value of was calculated according to Schwarzenbach (Citation2005) using Equation (3).
(3)
(3) Where u (m·s−1) is the average surface wind speed, 86,400 is used to convert the seconds to days (s·d−1), and 0.01 is used to convert from cm to m (m·cm−1).
Results and discussion
Monitoring
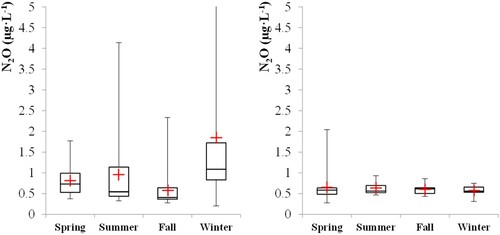
summarises the data obtained during the monitoring of Lake Horowhenua and the Turitea water reservoir. Chlorophyll a, total suspended solids and nutrients were found at a higher concentration at Lake Horowhenua. Expectedly, Lake Horowhenua was hypereutrophic over the entire duration of monitoring and the Turitea reservoir remained oligotrophic (S3). Both sites were sources of N2O (, see the time series in S4), with higher dissolved concentrations recorded at Lake Horowhenua than at the Turitea reservoir (p-value = 0.00034 for N2O concentration, two samples t-test, at 95% confidence) in agreement with past studies reporting high N2O emissions from eutrophic lakes (Teuma et al. Citation2023; ). DelSontro et al. (Citation2018) determined that N2O emissions from lakes could be expected to increase as a function of lake size and ‘chlorophyll a’ concentration. While the highest dissolved N2O concentration recorded occurred during a bloom in June 2022 at lake Horowhenua (as evidenced by the high chlorophyll a concentration, Figure S4), no strong positive correlation could be identified between the dissolved N2O concentrations and chlorophyll a (Figure S5). This supports the findings of Webb et al. (Citation2019) who reported a negative correlation between N2O emission and chlorophyll a concentration in highly eutrophic farm ponds.
Table 1. Summary of the monitoring from Lake Horowhenua (LH, n = 66) and the Turitea water reservoir (TR, n = 53), data represent min value – max value (average in parenthesis).
Table 2. N2O Fluxes (mg·m−2·d−1) reported from studies focusing on greenhouse gases emissions from lakes and reservoirs and acknowledging a relation between emissions and the presence of primary producers.
Biological N2O synthesis is strongly influenced by temperature, dissolved oxygen, the type and concentration of nitrogen compounds (Plouviez et al. Citation2019b; Kortelainen et al. Citation2020), and light intensity in the case of phytoplankton (Plouviez et al. Citation2017; Plouviez et al. Citation2019a, Citation2019b). No clear trend was observed from the time series (Figure S4) but dissolved N2O concentration increased at similar times to nitrate concentration in August 2021, December 2021 and June 2022. Overall, none of the water quality or meteorological parameters recorded could be correlated to dissolved N2O concentration (Figure S5). Nevertheless, a seasonal pattern was observed at Lake Horowhenua with the highest dissolved N2O concentration observed in winter (). Further monitoring at higher spatial and temporal sampling resolutions is needed to confirm our data.
Figure 1. Seasonal distribution of N2O dissolved concentration (µg·L−1) at Lake Horowhenua (left) and the Turitea reservoir (right).
N2O emissions from NZ lakes
Overall, higher N2O emissions were recorded in the eutrophic lake than in the oligotrophic reservoir used as control. This is worrisome because aquatic eutrophication is globally increasing and recent evidence showed the dominant species found in many microalgae blooms, Microcystsis aeruginosa, can synthesise N2O (Fabisik et al. Citation2023).
The distribution of the N2O concentrations reported at Lake Horowhenua was positively skewed as most values were clustered around the left tail of the distribution (Figure S6). The median was therefore used instead of the mean to prevent positive bias in our emissions estimates. Based on more than 12 months of monitoring data, we thus estimated N2O emissions from Lake Horowhenua to range from −0.05–6.93 mg-N2O·m−2·d−1 (n = 124 samples) with a median of 0.30 mg-N2O·m−2·d−1. At the Turitea reservoir, N2O emissions were estimated to −0.02–1.51 mg-N2O·m−2·d−1 with a median of 0.15 mg-N2O·m−2·d−1 (n = 106 samples). Overall, these N2O emissions are within the range of emissions previously reported from other lakes ().
NZ lakes cover approximately 1.3% of NZ land area of 26,8061 km2 (Nathan Citation2022). Considering that 46% of NZ lakes are eutrophic (MfE and Stats NZ Citation2020), the area of eutrophic lake represents 1610 km2 (or 161000 ha). Extrapolating our data to all NZ eutrophic lakes yields 0.175 kt N2O·yr−1 (equivalent to 52 kt CO2eq·yr−1). Based on the emissions recorded at the Turitea reservoir, the remaining ‘non eutrophic’ lakes could emit: 0.105 kt N2O·yr−1 (equivalent to 31 kt CO2eq·yr−1). The total N2O contribution from lakes to NZ`s N2O budget would therefore be low in comparison to other sectors such as agriculture (Table S7). Noteworthy, an assessment of the uncertainty N2O emissions at Lake Horowhenua showed median emissions can vary between 0.28 and 0.75 mg-N2O·m−2·d−1 according to the model used to compute the N2O mass transfer coefficient (Table S8). While this variability does not impact the conclusion of our research, greater consideration of the accurate prediction of this parameter is needed in the future (Dugan et al. Citation2016).
Preliminary emission factor for New Zealand lakes
The introduction of nitrogen into aquatic environments via agricultural (e.g. fertiliser leaching) and other anthropogenic activities (e.g. wastewater discharge) drives N2O emissions via various biological mechanisms (Ciais et al. Citation2013; Bartram et al. Citation2019; Hergoualc’h et al. Citation2019). Focusing on the agricultural sector, New Zealand Greenhouse Gases (GHG) inventory follows IPCC 2006 guidelines to compute indirect N2O emissions from rivers, lakes, and estuaries as a fraction of the amounts of N reaching these ecosystems via redeposition (2006 IPCC ‘EF4’ emission factor of 0.01 kg N2O-N·kg N applied−1) and leaching and runoff (2006 IPCC ‘EF5’ emission factor of 0.0075 N2O-N·kg N applied−1) (MfE Citation2023; Pickering et al. Citation2022). While the IPCC recently proposed that the EF5 factor should be increased to 0.011 (Hergoualc’h et al. Citation2019), it also highlighted the need to increase the N2O emission factor associated with wastewater discharge (EF discharge) into ‘nutrient-impacted (eutrophic) aquatic receiving environments’ nearly four-fold (Bartram et al. Citation2019), from 0.005 to 0.019 kg N2O-N·kg N−1. The IPCC bases this change on ‘research published between 1978 and 2017’ (Bartram et al. Citation2019).
While wastewater discharge stopped in 1987 at lake Horowhenua, the lake still receives nutrients via groundwater and eight streams (Gibbs et al. Citation2022). Based on an annual total nitrogen load of 185.5 t (Schallenberg and Vermeulen Citation2022) and assuming that 75% of the nitrogen load to the lake is found as nitrate (based on Table 3-2; Gibbs, Citation2011), 140 t of nitrate enter Lake Horowhenua each year. Using the median N2O emission of 0.30 mg N2O·m−2·d−1 (equivalent to 0.19 mg N2O-N·m−2·d−1) we experimentally recorded, we estimated an EF for Lake Horowhenua at 0.0019 kg N2O-N·kg NO3--N−1 which is similar to the 0.0012 kg N2O-N·kg NO3--N−1 estimated for lakes, ponds, and reservoirs by Tian et al. Citation2019. Overall, the EF estimated during our study is significantly lower than the EF4, EF5 and EF discharge recommended by the IPCC. Various authors have postulated that the IPCC methodology could overestimate N2O emissions from lentic surface water such as ponds and dams (Tian et al. Citation2019; Webb et al. Citation2021; Webb et al. Citation2023). Considering Lake Horowhenua can be considered as an ‘extreme’ case of highly eutrophic and N-loaded aquatic environment, our data suggests that NZ GHG budget may overestimate indirect N2O emissions from managed soils 7- to 10-fold (currently totally 1452 kt CO2-eq in 2021, including 566 kt CO2-eq via N leaching/runoff and 887 kt CO2-eq via N atmospheric deposition, MfE Citation2023). Further research is needed to confirm these findings and determine the most suitable tiered methodologies based on NZ-specific emissions factors.
Conclusions
We estimated N2O emissions from New Zealand lakes at 83 kt CO2eq·yr−1. Higher N2O emissions were recorded in the hypereutrophic lake than in the oligotrophic reservoir used as control. However, our emissions factor per kg of anthropogenic N input of 0.0019 was lower than the factors recommended by the IPCC. Noteworthy, we focused on two sites and therefore cannot reliably extrapolate our emissions data to all lake types and/or locations. A broader-scale monitoring is now therefore needed to confirm our data.
Supplemental Material
Download MS Word (1.9 MB)Acknowledgements
Massey University and the Greenhouse Gas Inventory Research Fund Funding, administrated by the Ministry for Primary Industries (Project#: 406614) are gratefully acknowledged. Access to the sampling site was kindly allowed by Prof. Jonathan Procter in close collaboration with the Lake Horowhenua Trust and Muaūpoko Tribal Authority. The Turitea water reservoir constitutes the main water supply for Palmerston North and access was kindly permitted by the Palmerston North City Council. Finally, Prof. Tim Clough is acknowledged for providing valuable feedback during this project.
Disclosure statement
No potential conflict of interest was reported by the authors.
Additional information
Funding
References
- Bartram D, Short MD, Ebie Y, Farkaš J, Gueguen C, Peters GM, Zanzottera NM, Karthik M, Masuda S. 2019. Refinement to the 2006 IPCC guidelines for national greenhouse gas inventories – Volume 5– Chapter 6: Wastewater treatment and discharge. Geneva, Switzerland: Intergovernmental Panel on Climate Change.
- Ciais P, Sabine C, Bala G, Bopp L, Brovkin V, Canadell J, Chhabra A, DeFries R, Galloway J, Heimann M, et al. 2013. Carbon and other biogeochemical cycles (Ch. 6). In: Stocker TF, Qin D, Plattner GK, Tignor M, Allen SK, Boschung J, Nauels A, Xia Y, Bex V, Midgley PM, editors. Climate change 2013: the physical science basis. Contribution of Working Group I to the fifth assessment report of The Intergovernmental Panel on Climate Change. Cambridge: Cambridge University Press; p. 465–570.
- Conley DJ, Paerl HW, Howarth RW, Boesch DF, Seitzinger SP, Havens KE, Lancelot C, Likens GE. 2009. Controlling eutrophication: nitrogen and phosphorus. Science. 323(5917):1014–1015. doi:10.1126/science.1167755.
- Deemer BR, Harrison JA, Whitling EW. 2011. Microbial dinitrogen and nitrous oxide production in a small eutrophic reservoir: an in situ approach to quantifying hypolimnetic process rates. Limnol Oceanogr. 56(4):1189–1199. doi:10.4319/lo.2011.56.4.1189.
- DelSontro T, Beaulieu JJ, Downing JA. 2018. Greenhouse gas emissions from lakes and impoundments: upscaling in the face of global change. Limnol Oceanogr Letters. 3(3):64–75. doi:10.1002/lol2.10073.
- Dugan HA, Woolway RI, Santoso AB, Corman JR, Jaimes A, Nodime ER, et al. 2016. Consequences of gas flux model choice on the interpretation of metabolic balance across 15 lakes. Inland Waters. 6(4):581–592. doi:10.1080/IW-6.4.836.
- Fabisik R, Guieysse B, Procter J, Plouviez M. 2023. Nitrous oxide (N2O) synthesis by the freshwater cyanobacterium Microcystis aeruginosa. Biogeosciences. 20:687–693. doi:10.5194/bg-20-687-2023.
- Gibb MM. 2011. Lake Horowhenua review assessment of opportunities to address water quality issues in Lake Horowhenua. Prepared by NIWA Hamilton for Horizons Regional Council, Horizons Regional Council Report No. 2011/EXT/1172, ISBN 978-1-927250-23-5.
- Gibbs MM, Roygard J, Patterson M, Brown L, Brown D. 2022. Factors influencing cyanobacteria blooms: review of the historical monitoring data to assess management options for Lake Horowhenua. New Zeal J Mar Fresh. 58:1–27. doi:10.1080/00288330.2022.2107028.
- Hergoualc’h K, Akiyama H, Bernoux M, Chirinda N, del Prado A, Kasimir A, MacDonald JD, Ogle SM, Regina K, van der Weerden TJ. 2019. Refinement to the 2006 IPCC Guidelines for National Greenhouse Gas Inventories—Volume 4 Agriculture, Forestry and Other Land Use. In: Chapter 11: N2O Emissions from Managed Soils, and CO2 Emissions from Lime and Urea Application. Geneva, Switzerland: Intergovernmental Panel on Climate Change.
- Jenny J-P, Francus P, Normandeau A, Lapointe F, Perga M-E, Ojala A, Schimmelmann A, Zolitschka B. 2016. Global spread of hypoxia in freshwater ecosystems during the last three centuries is caused by rising local human pressure. Glob Chang Biol. 22:1481–1489. doi:10.1111/gcb.13193.
- Kortelainen P, Larmola T, Rantakari M, Juutinen S, Alm J, Martikainen PJ. 2020. Lakes as nitrous oxide sources in the boreal landscape. Glob Chang Biol. 26:1432–1445. doi:10.1111/gcb.14928.
- McCrackin ML, Elser JJ. 2011. Greenhouse gas dynamics in lakes receiving atmospheric nitrogen deposition: greenhouse gases in lakes. Global Biogeochem Cy. 25(4):1–12. doi:10.1029/2010GB003897.
- Mengis M. 1997. Sources and sinks of nitrous oxide (N₂O) in deep lakes. Biogeochemistry. 37:281–301. doi:10.1023/A:1005814020322.
- Miao Y, Huang J, Duan H, Meng H, Wang Z, Qi T, Wu QL. 2020. Spatial and seasonal variability of nitrous oxide in a large freshwater lake in the lower reaches of the Yangtze River, China. Sci Total Environ. 721:137716. doi:10.1016/j.scitotenv.2020.137716.
- Ministry for the Environment and Stats NZ. 2020. Our Freshwater 2020. https://environment.govt.nz/assets/Publications/Files/our-freshwater-2020.pdf.
- Ministry for the Environment, New Zealand’s Greenhouse Gas Inventory 1990 – 2021. 2023. https://environment.govt.nz/assets/publications/GhG-Inventory/New-Zealand-Greenhouse-Gas-Inventory-1990-2020-Chapters-1-15.pdf.
- Nathan S. 2022. ‘Lakes – New Zealand lakes’, Te Ara – the Encyclopedia of New Zealand; [accessed 29 April 2023]. http://www.TeAra.govt.nz/en/lakes/page-1.
- Pickering A, Gibbs J, Wear S, Fick J, Tomlin H. 2022. Methodology for calculation of New Zealand’s agricultural greenhouse gas emissions. MPI Technical Paper, ISBN No: 978-1-99-001720-9.
- Plouviez M, Chambonnière P, Shilton A, Packer MA, Guieysse B. 2019a. Nitrous oxide (N₂O) emissions during real domestic wastewater treatment in an outdoor pilot-scale high rate algae pond. Algal Res. 44:101670. doi:10.1016/j.algal.2019.101670.
- Plouviez M, Fernandez E, Grossman RA, Sanz-Luque E, Sells M, Wheeler D, Guieysse B. 2021. Responses of Chlamydomonas reinhardtii during the transition from P-deficient to P-sufficient growth (the P-overplus response): the roles of the vacuolar transport chaperones and polyphosphate synthesis. J Phycol. 57(3):988–1003. doi:10.1111/jpy.13145.
- Plouviez M, Guieysse B. 2020. Nitrous oxide emissions during microalgae-based wastewater treatment: current state of the art and implication for greenhouse gases budgeting. Water Sci. Technol. 82:1025–1030.
- Plouviez M, Shilton A, Packer MA, Guieysse B. 2019b. Nitrous oxide emissions from microalgae: potential pathways and significance. J Appl Phycol. 31(1):1–8. doi:10.1007/s10811-018-1531-1.
- Plouviez M, Wheeler D, Shilton A, Packer MA, Mc Lenachan PA, Sanz-Luque E, Francisco O-C, Fernández E, Guieysse B. 2017. The biosynthesis of nitrous oxide in the green algae Chlamydomonas reinhardtii. Plant J. 91:45–56. doi:10.1111/tpj.13544.
- Ravishankara AR, Daniel JS, Portmann RW. 2009. Nitrous oxide (N₂O): the dominant ozone-depleting substance emitted in the 21st century. Science. 326(5949):123–125. doi:10.1126/science.1176985.
- Schallenberg M, Vermeulen M. 2022. Phosphorus and Nitrogen Budgets for Lake Horowhenua, Report No. 2022/EXT/1780.
- Schwarzenbach PM. 2005. Air-water exchange. In: Schwarzenbach RP, Gschwend PM, Imboden DM, editors. Environmental organic chemistry. 2nd ed. Hoboken, NJ: John Wiley and Sons, Inc; p. 887–943.
- Teuma L, Sanz-Luque E, Guieysse B, Plouviez M. 2023. Are microalgae new players in nitrous oxide emissions from eutrophic aquatic environments? Phycology. 3(3):356–367. doi:10.3390/phycology3030023.
- Tian H, Xu R, Canadell JG, Thompson RL, Winiwarter W, Suntharalingam P, Davidson EA, Ciais P, Jackson RB, Janssens-Maenhout G, et al. 2020. A comprehensive quantification of global nitrous oxide sources and sinks. Nature. 586(7828):248–256. doi:10.1038/s41586-020-2780-0.
- Tian L, Cai Y, Akiyama H. 2019. A review of indirect N2O emission factors from agricultural nitrogen leaching and runoff to update of the default IPCC values. Environ Pollut. 240:300–306. doi:10.1016/j.envpol.2018.11.016.
- Wang H, Wang W, Yin C, Wang Y, Lu J. 2006. Littoral zones as the “hotspots” of nitrous oxide (N₂O) emission in a hyper-eutrophic lake in China. Atmos Environ. 40(28):5522–5527. doi:10.1016/j.atmosenv.2006.04.045.
- Webb JR, Clough TJ, Quayle WC. 2021. A review of indirect N2O emission factors from artificial agricultural waters. Environ Res Lett. 16:e043005.
- Webb JR, Hayes NM, Simpson GL, Leavitt PR, Baulch HM, Finlay K. 2019. Widespread nitrous oxide undersaturation in farm waterbodies creates an unexpected greenhouse gas sink. PNAS. 116(20):9814–9819. doi:10.1073/pnas.1820389116.
- Webb JR, Quayle WC, Ballester C, Wells NS. 2023. Semi-arid irrigation farm dams are a small source of greenhouse gas emissions. Biogeochemistry. 166:123–138. doi:10.1007/s10533-023-01100-4.
- Wood SA, Maier MY, Puddick J, Pochon X, Zaiko A, Dietrich DR, Hamilton DP. 2017. Trophic state and geographic gradients influence planktonic cyanobacterial diversity and distribution in New Zealand lakes. FEMS Microbiology Ecology. 93(2):fiw234. doi:10.1093/femsec/fiw234.
- Xiao Q, Xu X, Zhang M, Duan H, Hu Z, Wang W, Lee X. 2018. Coregulation of nitrous oxide emissions by nitrogen and temperature in China's third largest freshwater lake (Lake Taihu). Limnol Oceanogr. 64(3):1070–1086. doi:10.1002/lno.11098.
- Xu H, Paerl HW, Qin B, Zhu G, Gaoa G. 2010. Nitrogen and phosphorus inputs control phytoplankton growth in eutrophic lake Taihu, China. Limnol Oceanogr. 55:420–432. doi:10.4319/lo.2010.55.1.0420.
- Yang X, Wu X, Hao H, He Z. 2008. Mechanisms and assessment of water eutrophication. Journal of Zhejiang University Science B. 9(3):197–209. doi:10.1631/jzus.B0710626.