
 ?Mathematical formulae have been encoded as MathML and are displayed in this HTML version using MathJax in order to improve their display. Uncheck the box to turn MathJax off. This feature requires Javascript. Click on a formula to zoom.
Abstract
The disappearance of the social gradient in fertility represents a paradigm shift that has called into question the validity of theories that predicted a decline in fertility with increased access to education and resources. Emerging theories have tried to explain this trend by highlighting a potential change in the fertility preferences of more educated couples. In this paper we add additional elements to this explanation. Using a computational modelling approach, we show that it is still possible to simulate the weakening social gradient in fertility, in the context of steady declines in family size preferences. Our results show that one of the key drivers of the change in the education–fertility relationship can be found in the transition to an increasingly regulated fertility regime. As the share of unplanned births decreases over time, the negative association between education and fertility weakens and the mechanisms that positively connect educational attainment with desired fertility become dominant.
Introduction
In most developed countries, the decline in fertility started in the late nineteenth century and continued for about 100 years, interrupted only by the temporary increase in fertility around the mid-twentieth century commonly known as the baby boom. The century-long reduction in average family size coincided with a period of sustained increases in living standards and educational attainment, which by the 1970s made the negative association between educational attainment and fertility one of the most established regularities in the social sciences (Cochrane Citation1979).
Perceptions of the relationship between education and fertility started to change in the late 1980s, after a series of studies suggested that a positive effect of education on the transition to higher-order births was emerging (Hoem and Hoem Citation1989; Kravdal Citation1992). Although follow-up studies revealed the existence of significant selection effects (Kravdal Citation2001; Kreyenfeld Citation2002; Kravdal and Rindfuss Citation2008), fertility researchers started paying more attention to the changing educational gradient in fertility.
Although fertility differentials across cohorts have remained stable in some settings (Berrington et al. Citation2015; Sobotka et al. Citation2017), the convergence of fertility rates among women with different levels of educational attainment has been documented in an increasing number of countries (Kravdal and Rindfuss Citation2008; Caltabiano et al. Citation2009; De Wachter and Neels Citation2012; Merz and Liefbroer Citation2017). The reversal, or weakening, of the relationship has also been well documented at the macro level by studies examining the association between fertility rates and a series of social and economic development indicators, such as the Human Development Index (Myrskylä et al. Citation2009), women’s labour force participation (Rindfuss and Brewster Citation1996; Ahn and Mira Citation2002), and gross domestic product per capita (Luci-Greulich and Thévenon Citation2014).
These results are frequently interpreted as the expression of a fundamental change in how education and resources shape fertility preferences, that is, as a return to larger families, which has been made possible by a fairer distribution of unpaid work among better educated couples (Esping-Andersen and Billari Citation2015; Goldscheider et al. Citation2015). However, fertility preferences in advanced economies have shown no indication of a recovery. Recent studies suggest that people’s intended number of children has instead continued to decline, across education levels (Hartnett and Gemmill Citation2020; Golovina et al. Citation2023).
In this paper we offer a complementary explanation for why it is still possible to observe a reduction in the educational gradient in fertility, in the context of steadily declining fertility preferences across education groups. Using a computational model of the reproductive process, we generate a scenario in which the narrowing of the educational gradient in fertility is driven not by a change in preferences but by a sustained decline in unplanned births as societies progress to an increasingly regulated fertility regime. Simply put, we argue that as long as unplanned births represent a significant share of total fertility, the effect of educational attainment on fertility outcomes will tend to be negative, as more information and resources help women and families to reduce excess fertility. Once fertility becomes fully regulated, however, the positive mechanisms that connect information and resources with fertility outcomes become dominant and the statistical association reverses.
In addition, we argue that contrary to how the relationship between education and fertility is usually depicted, the mechanisms that positively connect higher levels of resources and education with fertility outcomes have been present throughout the fertility transition, although overshadowed for a certain period of time by the presence of other, more dominant effects.
Our perspective implies that fertility can be understood as the composite expression of two qualitatively different behavioural processes. In the first process, a birth is the result of a decision; that is, it can be linked to the usual mechanisms represented in models of reproductive decision-making, including utility maximization, social influence, and preferences. In the second process, a birth is the result of an unintentional act and is thus an event that cannot be linked to a cost–benefit analysis or choice mechanism. As a result, aggregate measures of fertility, such as the total fertility rate (TFR), can be seen as composed of two distinct parts: an unintentional fraction, which comprises a progressively smaller share of total fertility as societies develop; and an intentional fraction, which becomes dominant as the reproductive process becomes increasingly regulated.
Shifting the focus of analysis from total fertility to the gap between desired and observed fertility offers a completely different perspective on the microfoundations of the reversal in the correlation between socio-economic development and fertility. As Bongaarts (Citation2001) has shown, this gap tends to be negative during the earlier phases of the demographic transition, when achieved fertility exceeds desired fertility, but it turns positive as societies reach the end of the demographic transition and the average number of children moves below the desired number, reflecting a fertility deficit.
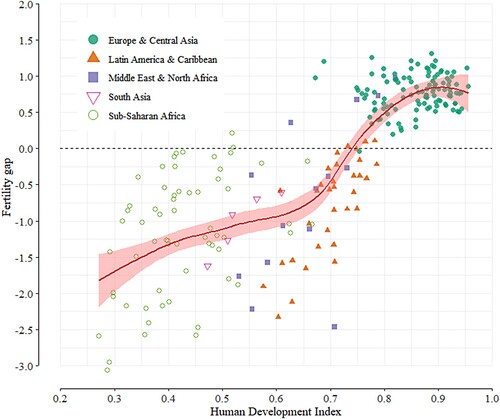
As shown in , countries with above-average mortality and substandard levels of education and income per capita tend to report excess fertility, whereas countries that perform better on these dimensions tend to show fertility deficits. However, in the countries with the very highest Human Development Index (HDI) values, the gap between observed and average desired fertility tends to be smaller. Although the average gap seems to be smallest in countries that are midway through the development process (with HDI values of around 0.75), this is likely an artefact: that is, the result of heterogeneity in the population and a ‘double dissatisfaction’ scenario, whereby a fraction of the population continues to have more children than they want, while another fraction is already achieving a smaller-than-desired family size (Kulkarni and Choe Citation1998).
Figure 1 Association between the Human Development Index and the fertility gap, by world region, 1976–2005
Notes: The HDI is a summary measure of average achievement in three dimensions of human development: length of life, educational attainment, and material living standards. It is calculated as the geometric mean of normalized indices for each of the three dimensions. The fertility gap is measured by subtracting total fertility from the average desired number of children. Observations correspond to different countries and to different points in time for the same country. A fertility gap above zero indicates excess fertility; a fertility gap below zero indicates a fertility deficit. The solid line represent the LOESS regression estimate.
The implication of these results is that given better information that allows the distinction to be made between planned and unplanned fertility, a different relationship will be observed between increased individual resources and these two components of total fertility. This is precisely what the very limited empirical evidence available on this relationship shows. From analysing a cohort of women born in the United States (US) in 1957–64, Musick et al. (Citation2009) found that the negative educational gradient in completed fertility was explained largely by the significantly higher observed share of unplanned births among less educated women: a result that resembles Becker’s (Citation1960) initial findings, as we discuss in more detail in the next section.
In the remainder of this paper, we work around some of the limitations imposed by the lack of relevant information, for example on the distinction between planned and unplanned fertility. In a first step, we take a computational model that makes an explicit distinction between the mechanisms that lead to planned vs unplanned births, and we use it as a data-generating process. In other words, we use our model to simulate a population of women and their reproductive histories, from a known set of mechanisms. In a second step, we carry out on our simulated data the same analysis performed by Kravdal and Rindfuss (Citation2008) on observed data from Norway, a study that avoided the potential pitfalls in the analysis of fertility differentials by education. This shows that the weakening educational gradient in fertility can be reproduced in a simulated population where the way in which education shapes fertility preferences remains constant over time but where there is a significant reduction in the proportion of unintended births.
Our analysis also illustrates how computational models can be used in combination with more traditional approaches to generate evidence regarding the potential drivers of any given process.
Background
Increased resources and fertility: Theory
Because educational attainment measures are usually easier to obtain than reliable estimates of income or wealth, they are widely used in empirical studies as a way of classifying individuals according to their resources and ability. Thus, the discussion surrounding the relationship between education and fertility tends to overlap with the discussion surrounding the relationship between income and fertility.
One of the reasons for these relationships receiving so much attention is the observed long-run negative association between increased resources and fertility outcomes. From a theoretical point of view, this is an unexpected and somewhat puzzling observation that challenges most established analytical frameworks in the social sciences, from evolutionary anthropology to economics. In all these frameworks, first principles indicate that increased access to resources should result in a larger number of offspring.
Over time, this inability to ground the observed relationship on a well-established theoretical basis has led to the formulation of a number of ad hoc hypotheses. Two of the most influential ideas in our current understanding of this problem come from neoclassical economic models: namely, the idea of opportunity costs and the idea of a quantity–quality trade-off (Becker and Lewis Citation1973; Becker and Tomes Citation1976).
The popularity of these concepts lies in their perceived ability to explain the observed negative association between increased access to resources and fertility. However, a closer look shows that neither the opportunity costs mechanism nor the quality of children mechanism is enough to generate this negative relationship (Jones et al. Citation2010). Within a neoclassical framework, a decrease in fertility cannot be produced in the context of increasing resources unless additional restrictive assumptions are included in the models: namely, that the time needed to raise a child is incurred exclusively by the parents (no outsourcing) and, more importantly, that the preferences of individuals differ along income lines. As Galor (Citation2012) put it, the theory ‘hinges on the supposition that individuals’ preferences reflect an innate bias against child quantity beyond a certain level of income’.
Indeed, the assumption that less advantaged individuals hold stronger preferences for children than more advantaged individuals has been repeatedly disproved by research on long-term fertility intentions (De Wachter and Neels Citation2012; Berrington and Pattaro Citation2014; Testa Citation2014). But perhaps the biggest limitation of neoclassical economic models of fertility dynamics is the need to assume perfect control over the reproductive process. Interestingly, Becker’s first attempt to understand the family formation process avoided these pitfalls (Becker Citation1960). In his original study, the negative relationship between income and fertility was presented not as the outcome of a trade-off between the quantity and the quality of children but, rather, as resulting from the omission of a key variable: knowledge about contraception. To test this idea, Becker analysed the relationship between income and fertility by separating couples according to whether or not they had planned their children, and he indeed found a positive relationship between economic status and desired fertility:
An increase in income or a decline in the cost of children would affect both the quantity and quality of children, usually increasing both. An increase in contraceptive knowledge would also affect both but would increase quality while decreasing quantity. … Differential knowledge of contraception does convert a positive relation between income and desired fertility into a negative relation between income and actual fertility. Becker (Citation1960) (italic in the original)
Unplanned fertility
Although analyses of the first demographic transition paid considerable attention to fertility control, especially those that looked at the supply side (Easterlin and Crimmins Citation1985), the discussion of fertility trends in the post-war era was completely dominated by social and economic arguments. In the report of the 1981 International Union for the Scientific Study of Population meeting on low fertility in Europe, Wulf (Citation1982, p. 269) noted, ‘The practice of contraception … is barely mentioned in the course of the population policy debate currently being waged in Europe’.
In fact, the overwhelming majority of demographic analyses of unplanned fertility have focused on less developed countries (Bongaarts Citation1990, Citation1997, Citation2003) and, to some extent, the US, where high unplanned pregnancy rates among less educated young women have long been a pressing public health concern (Henshaw Citation1998; Boonstra et al. Citation2006; Finer and Henshaw Citation2006; Musick et al. Citation2009).
The scarcity of studies in European countries is likely due both to challenges in measurement and to the underestimation of the influence of unintended births on contemporary fertility trends. The few available studies, however, have consistently shown the key role played by unintended fertility in the post-baby-boom fertility transition. Murphy (Citation1993) showed that the use of the contraceptive pill played a major role in Britain’s fertility decline of the 1960s and 1970s. Similarly, Régnier-Loilier et al. (Citation2007) attributed half the decline in fertility rates in France in the 1970s to the drop in unplanned births. Moreover, it has been estimated that 25 per cent of births to women born in Italy around 1950 were unplanned (Castiglioni et al. Citation2001). If we consider that these cohorts reached their peak reproductive years during the 1970s and 1980s, and therefore after the diffusion of effective contraceptive methods, it seems reasonable to assume that the fraction of unplanned births among women of earlier cohorts was even larger. In the case of Norway, our own analysis of survey data from 1988 (Statistics Norway Citation2011) showed that around one-third of interviewed mothers thought that their first pregnancy had occurred earlier than expected.
Education and fertility: Empirical approaches
As mentioned earlier, efforts to identify a positive association between educational attainment and fertility outcomes date back to the 1980s. The typical approach to addressing this question has relied on the estimation of educational gradients across cohorts using hazard regression models for the transitions to second and third births. For example, a study using Swedish data found higher relative risks of transitioning to a second or third birth for women with higher education, when their age at first birth and employment status were controlled for (Hoem and Hoem Citation1989), while another study reported a positive relationship between education and third-birth rates for married Norwegian women (Kravdal Citation1992).
While these findings of a positive relationship between women’s educational attainment and fertility outcomes were unprecedented, they were theoretically plausible in the Scandinavian context, where full-time day care, job protection for mothers, and the relatively high level of involvement of fathers in housework supported the compatibility of family and employment. But when similar results were repeatedly found for the former West Germany as well (Huinink 1989, 1995, 2001, all cited in Kreyenfeld Citation2002), it became clear that a closer examination of this relationship was needed.
Indeed, the positive effect of education on the transition to higher-order births turned negative when the transitions to births of different orders were modelled jointly and a parameter to capture unobserved heterogeneity was included in the regression models (Kravdal Citation1992; Kreyenfeld Citation2002). These models were designed to control for heterogeneity in family formation preferences (family proneness), which can lead to biased estimates when comparing women who had a previous child at the same age but belong to different educational groups.
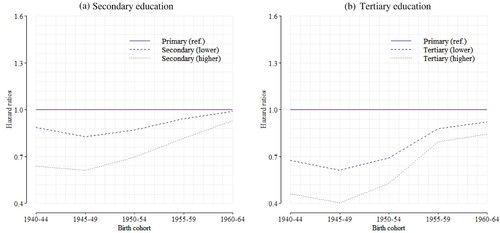
Revisiting the problem years later, Kravdal and Rindfuss (Citation2008) showed that the negative effect of education on higher-order births had disappeared for recent cohorts of women in Norway, even after controlling for selection effects. This study remains one of the central references in the literature. Thus, we take it as a reference point in developing our argument. In , we present coefficients from hazard regression models of the risk of having a second birth by educational attainment and cohort, as reported in their study. Both panels show a convergence among educational groups over time, that is, a reduction in the negative effect of education for women with higher education as their hazard rate approaches that of the group of women with less education (i.e. approaches 1.0 on the y-axis).
Figure 2 Hazard ratios of transitioning to a second child by cohort and educational level, as reported in Kravdal and Rindfuss (Citation2008): women, Norway
Note: The lowest educational level (primary) is the reference category.
In the following sections, we show how these results can be replicated using simulated data generated by a known data-generating process: in other words, how a model with a well-defined set of social and behavioural mechanisms can produce data that resemble those displayed in . However, before proceeding, we provide descriptions of our simulation model and of the statistical models applied to our simulated data in order to replicate the results from Kravdal and Rindfuss (Citation2008) introduced in this section.
Methods
Simulation model
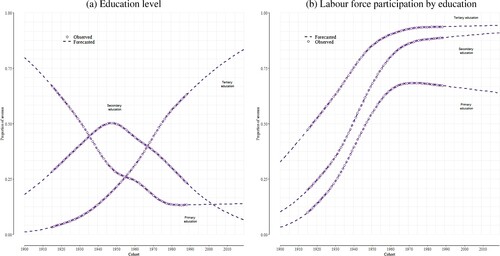
We generated synthetic reproductive trajectories for the cohorts of Norwegian women born between 1940 and 2018 using the discrete-event simulation model developed by Ciganda and Todd (Citation2022). These trajectories start with the formation of a heterosexual cohabiting union. After a union is formed, the partners agree on a desired family size, which they will actively try to achieve before the female partner reaches age 50 or dies. Every 12 months, the partners must decide whether or not to have a child in the next year: a decision that depends on the time elapsed since the last birth (if any), the educational level of the female partner, and her labour market participation status (the latter two being assigned from the empirical distributions shown in ). After the partners make the decision, the probability of actually having a birth depends on the risk of conception for non-contracepting women of a given age (i.e. fecundability). But even if they decide not to have a child, they are still subject to the risk of experiencing an unplanned pregnancy.
Figure 3 Observed and forecasted proportions of women by (a) education level and (b) labour force participation by education: cohorts, Norway
Notes: As the data clearly show, the proportion of women who have attained tertiary education and the proportion of women participating in the labour market have increased significantly over time. Although our simulation model classifies the simulated women as inactive/active in the labour market, here, for the sake of clarity, only the proportion of women actively participating in the labour market is displayed in panel (b). See the Data subsection for more information on these data and indicators.
In this sense, our approach is similar to that of Heckman and Willis (Citation1976), where fertility outcomes are the product of a series of sequential contraceptive decisions and a stochastic biological component. However, in our model, a couple’s desired family size represents a long-term goal, shaped in part by existing social norms regarding the appropriate size of a family at the time they marry or start cohabiting.
Couples in our model may or may not be able to achieve their desired number of children, depending on the efficacy of the contraceptive methods available to them during their reproductive life and the amount of time they have to form a family after completing their formal education period (see the Appendix, section A4, for more details).
One important assumption the model makes is that participating in the labour market imposes a penalty on the intention to have a child, given the time constraints and the competing interests that most working women face when they become a parent. But we also let educational attainment alleviate this penalty as a means of incorporating a number of mechanisms that positively connect access to higher education and resources to fertility decisions. These mechanisms include: increased ability to outsource childcare and housework or to negotiate a fairer division of unpaid work within the household; more flexible working hours; and fewer difficulties re-entering the labour market after spells of inactivity.
The model then allows for fertility outcomes to be positively associated with an individual’s educational level, but it also incorporates three other mechanisms through which a higher level of education implies a reduction in the number of children achieved at the end of a woman’s reproductive life. First, we assume that dual-earner households tend to want a smaller number of children than households with a male-breadwinner arrangement. Given that more highly educated women show higher levels of labour market participation, that assumption implies a negative association between educational attainment and desired family size. Second, following the literature on the adoption of effective contraceptive methods, we allow the risk of an unplanned birth to be reduced for more educated women; this implies a negative correlation between educational attainment and excess fertility. Finally, given that most people wait until they have finished their education before starting a family, we make formation of a cohabiting union dependent on the number of years spent in formal training. This implies a reduction in the length of time that women are exposed to the risk of pregnancy, which will, in many cases, translate into a smaller achieved family size.
As a result, changes in fertility outcomes in our model are driven by (observed) changes in the distributions of educational attainment and labour force participation (by education) over time. As explained in the Introduction, our hypothesis is that the change in the weight of the negative vs positive effects of education on fertility can explain the reduction in the negative educational gradient in fertility over time.
A more technical discussion of the mechanisms described in this subsection can be found in the Appendix. The model was implemented in R (R Core Team Citation2020). All the code and data necessary to reproduce the results presented in the paper can be found here: https://github.com/dciganda/comfert_edu.
Data
Administrative register data from Norway contain a unique ID for every resident, making it possible to link information from different registers. The population register and other administrative registers covering the entire resident population of Norway were used to calculate completed cohort fertility by education and to create annual tables on the highest level of education attained and labour force participation by birth cohort. In line with Kravdal and Rindfuss (Citation2008, p. 858), we excluded individuals not born in Norway.
Completed cohort fertility at age 40 was computed from a data set that provides links between all registered individuals and their children. Next, annual data displaying the resident population at the beginning of each year were linked to information from Statistics Norway’s National Education Database, to obtain the highest level of education attained by women in the birth cohorts analysed. We considered three levels of education, corresponding to International Standard Classification of Education (ISCED) levels 1–2, 3–4, and 5–6.
A similar approach was used to calculate the proportion of women in the labour market (aged 30–55 years, when most have finished education) by highest level of education and cohort. Here we had access to data from the Income and Tax Register and Statistics Norway’s Event History Database for the years 1967–2014. We extracted information on annual income obtained through employment or self-employment. If the annual income obtained through employment and/or self-employment was at least twice the annual basic amount in the National Insurance Scheme (The Norwegian Tax Administration Citation2023), individuals were defined as active, otherwise as inactive. This basic amount is used as a basis for calculation of pensions and other social benefits.
Estimation
After we set up our model, the objective was to find the combination, or distribution of combinations, of parameter values that could provide a better fit to the available data for Norway. We did so by relying on a likelihood-free estimation approach, which, as its name indicates, allows for inference and uncertainty quantification in a context where it is not possible to obtain an analytical expression of the likelihood but it is possible to simulate the model output at different combinations of parameter values. Specifically, we used an approximate Bayesian computation (ABC) algorithm (see Beaumont Citation2010, Citation2019). The typical ABC algorithm proceeds by simulating realizations of a model’s outcome from different parameter values and by retaining those values which produce outcomes that are ‘close’ to the observed data according to a given metric of distance, such as the mean squared error (MSE).
The specific approach we applied for this analysis was proposed by Gutmann and Corander (Citation2016) and relies on Bayesian optimization to perform an efficient search of the parameter space. This approach reduces computation time by focusing on the region of the parameter space where the distance between simulated and observed data is small.
In more formal terms, let X ⊂ Rd be the parameter space, where d is the number of parameters. At a given combination of parameter values θ ∈ X, we computed Δθ, the MSE at this location, as a weighted mean of the MSEs for two vectors:
Age-specific fertility rates (ASFRs) for ages 14–50 for the 1960–2018 period, available from the Human Fertility Database (Citation2011); and
Completed cohort fertility by education, obtained from Zeman et al. (Citation2014).
The objective of the algorithm is to find the region of the parameter space where the distance Δθ is smallest. To achieve this, it proceeds sequentially, taking a sample of k locations θ1, … , θk from X and computing Δθ1, … , Δθk. The information collected in this way is then used to decide where to search next in the parameter space. The distance Δθ is then computed on a new set of locations.
At this point the original model is substituted by an emulator (i.e. a model of the functional relationship between the model parameters and the distance). This avoids the need to compute the model at each of these new points. We built our emulator by fitting a Gaussian process regression using the R package ‘mlegp’ (Dancik and Dorman Citation2008).
The emulator imitates the behaviour of the original model and allows the user to obtain predictions of the distance Δθ at any combination of parameter values, without the need to run the original model. After a new series of predictions is obtained, an acquisition function decides at which of these points the model should be run again to evaluate the true distance from the observed data. The function considers two criteria: the locations with optimal expected values (where Δθ is small) and the locations where uncertainty is higher. This allows the algorithm to focus on promising regions of the parameter space without getting stuck at local minima.
The following pseudocode describes the basic operation of the algorithm:
Hazard regression models
Using the procedure described in the preceding subsection, we found the combination of parameter values that produced the simulated reproductive trajectories that most closely resembled the observed trajectories of Norwegian women in the cohorts of interest. Estimated parameter values are presented in , Appendix. With these values as input, we produced a new simulation with a larger number of trajectories. Using the information on age of mother at each birth and her educational attainment level, we built a simulated data set identical in structure to the one used by Kravdal and Rindfuss (Citation2008). This information alone is sufficient to answer the question of whether our proposed data-generating mechanism can reproduce the observed convergence in the risks of higher-order births for women with different levels of educational attainment in Norway. But our simulated data allowed us to go a step further and explore the relationship between education and desired fertility (i.e. how education affects the risk of an additional planned birth), an analysis that is similar in concept to that originally proposed by Becker (Citation1960) (see Background section).
To obtain estimates comparable to those presented in Kravdal and Rindfuss (Citation2008), we modelled the hazard of transitioning to higher-order births in our simulated data using a discrete-time hazard regression approach with complementary log–log link function. We followed their approach also by estimating separate models for each transition (i.e. second and third births) and for each five-year birth cohort and by modelling the baseline duration using linear splines (with one knot at age 35 in the case of age and four knots at two, four, six, and eight years in the case of time since previous birth).
To explore the relationship between educational attainment and desired fertility, we considered only planned births; that is, we removed births that occurred after the couple in the simulation had reached their desired family size. As we argued earlier, removing unplanned fertility should result in estimates that reflect a neutral-to-positive association between educational attainment and the risk of having a second or a third birth.
Results
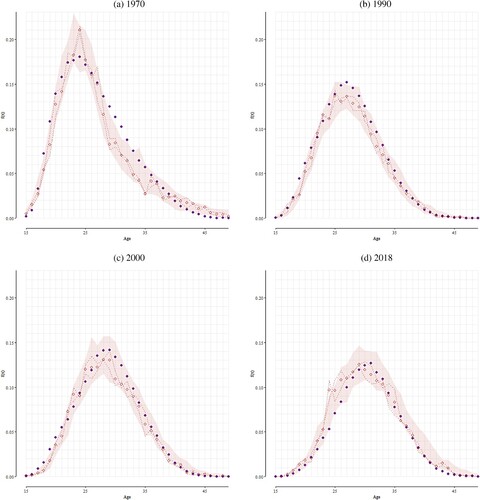
We start this section by presenting the fit of our model to a number of indicators that summarize the dynamics of Norwegian fertility over time. shows simulated vs observed ASFRs in Norway, for selected years since 1970. The model reproduces the long-term, post-baby-boom decline in fertility rates in Norway and also the substantial postponement of fertility during this period, expressed here as a downward and rightward shift in the ASFR distribution.
Figure 4 Observed vs simulated age-specific fertility rates: Norway, selected years
Notes: Observed age-specific fertility rates are plotted as solid diamonds. Dashed lines represent two separate simulations with the set of parameter values that best fit the observed data. The transparent diamonds represent the mean of these two simulations. The shaded area shows 95 per cent prediction intervals (range of values that contains the central 95 per cent of the posterior predictive distribution).
shows that the model also closely reproduces several key dimensions of the fertility dynamics observed in Norway since the second half of the twentieth century, as expressed by the evolution of completed cohort fertility (), completed cohort fertility by education (), and the mean age at birth (). These results indicate that the trajectories generated by the model resemble those of real Norwegian women in the period along multiple dimensions: namely, the number of children each woman had ever had by the end of her reproductive life; the timing of those births; and, importantly, the differences observed between women with different educational attainment levels.
Figure 5 Model fit and 95 per cent prediction intervals: selected fertility indicators, Norway
Notes: Observed age-specific fertility rates are plotted as solid diamonds. Dashed lines represent two separate simulations with the set of parameter values that best fit the observed data. The transparent diamonds represent the mean of these two simulations. The shaded area shows 95 per cent prediction intervals (range of values that contains the central 95 per cent of the posterior predictive distribution).
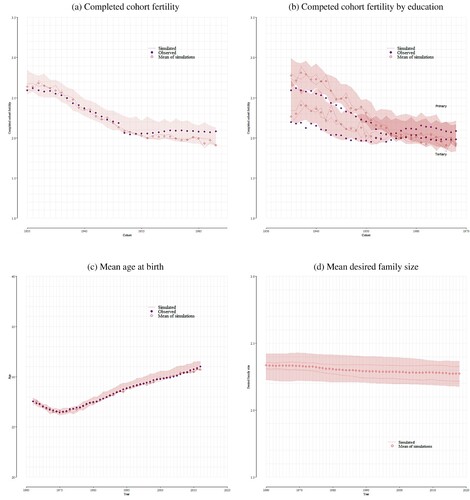
Indeed, shows that the simulated data reproduce the observed convergence in achieved family size among women with different educational attainment levels. In the simulated population, this trend is driven mostly by faster declines in the share of unplanned births among women with non-tertiary education compared with women with tertiary education. It is important to note as well that this convergence is observed in the context of a sustained decline in family size preferences overall ().
The evolution of the mean age at birth () shows that the potential gains in total fertility in a more resourceful population whose members are increasingly capable of achieving their fertility goals can be counterbalanced by further reductions in the time available to form a family as education continues to expand.
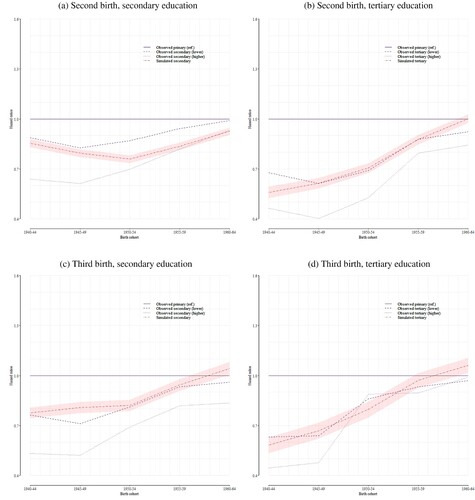
Moving to the micro level, we now explore whether the data-generating process implied by the model is able to reproduce the observed trends in the risks of transitioning to higher-order births across cohorts in Norway. compares hazard ratio estimates for the transitions to second and third children obtained from the simulated data with those reported by Kravdal and Rindfuss (Citation2008) using the same modelling approach. The trend described by the simulated data follows the observed trend, showing that the risks of a second birth () and third birth () for women with secondary/tertiary education become more similar over time to the risk experienced by women with only primary education. As noted, this is largely related to the decline in the share of unplanned births among women with less education.
Figure 6 Hazard ratios for the transitions to second and third births by cohort and educational level for women in Norway: simulated vs observed results
Notes: The lowest education level (primary) is the reference category. Given that the focus of the analysis is the changes over time, the simulation model does not distinguish between different levels of secondary or tertiary education. Simulated results are reported with 95 per cent confidence intervals (shaded areas). The uncertainty of the estimates computed on the observed data is not reported in Kravdal and Rindfuss (Citation2008). See Data subsection for additional details on the educational attainment data. More information on the hazard regression models, including the coefficients presented here, can be found in the supplementary material.
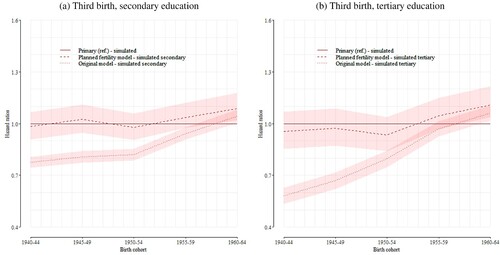
We now focus exclusively on the simulated data and compare the results from the original model with those obtained when the outcome considered is planned fertility instead of total fertility, which means we consider only those births that are the result of a decision. We focus on third births here, as these dynamics can be more clearly appreciated for higher-order births. As discussed earlier, the results obtained from the simulated data show the same pattern of convergence as the results obtained from the observed data, with the educational gradient in total fertility disappearing over time. In the case of the transition to a third birth, more specifically, the gradient disappears for the two most recent cohorts (). However, when the same hazard regression models are applied to simulated data that refer only to planned births, the gradient also disappears for the most recent cohorts (). The results for second births also suggest a narrowing gap between educational attainment groups (see Figure B1, supplementary material).
Figure 7 Hazard ratios for the transition to third birth by cohort and educational level for women in Norway: comparison of model specifications
Note: The lowest education level (primary) is the reference category. Simulated results are reported with 95 per cent confidence intervals (shaded areas).
Discussion
The recently observed reversal of the negative correlation between development and fertility has allowed theory and evidence to be realigned, resolving a long-standing paradox in the social sciences. At the same time, the reversal has challenged a number of ad hoc hypotheses put forward over the years to explain why privileged access to information and resources was associated with reduced family sizes.
In this paper we have tried to demonstrate how our understanding of the relationship between education and fertility throughout the fertility transition could be significantly improved by explicitly including in our models the frequently omitted but key distinction between intended and unintended fertility.
Human fertility provides a perfect example of how an identical outcome—in this case, a birth—can emerge from completely different underlying behavioural processes, which should therefore be modelled accordingly. A planned/wanted birth is the result of a goal-seeking behaviour; therefore, the risk of experiencing such a birth should be positively associated with the additional ability provided by privileged access to resources. Conversely, an unplanned birth results from the inability to control the reproductive process; therefore, experiencing such an event should be negatively associated with the skills acquired through formal schooling and with the individual and family resources that usually contribute to the achievement of higher educational levels.
Starting with this simple premise, we set out to show that the disappearing educational gradient in fertility at the micro level, and the corresponding reversal of the relationship between development and fertility at the macro level, should be analysed in the context of the decline in the share of unplanned births across cohorts. In other words, the diffusion of effective contraceptive methods has made women’s life courses more similar with respect to the number of unplanned births they experience throughout their reproductive lives. As populations move to an increasingly regulated fertility regime, the fertility-reducing effects of education and access to resources become less dominant and the role of these characteristics in the ability to fulfil fertility preferences becomes more evident.
We tested this hypothesis by implementing the aforementioned dynamics in a simulation model and showed that the data-generating mechanism implied by the model can reproduce Norway’s disappearing educational gradient in fertility at the same time as capturing the stylized facts of the post-baby-boom fertility dynamics in this Scandinavian country. We also showed that when only planned fertility is considered, the educational gradient in the risk of experiencing higher-order births narrows.
Although the reversal of the statistical association between education and fertility is usually interpreted as resulting from changes in preferences, we showed that this reversal can be observed (simulated) in the absence of a parallel reversal at the level of individual behaviour and in the presence of a continuous decline in family size preferences across socio-economic strata. This does not necessarily mean that preferences have played no role in the reversal process. Our results do indicate, however, that the role played by preferences needs to be considered in the context of the long-term decline in unintended births and its impact on our measures of statistical association between individual characteristics and fertility outcomes.
Finally, our analysis also helps to demonstrate the potential of individual-level computational models for providing a complementary perspective to that offered by more established modelling approaches in the social sciences. The flexibility of the computational approach allowed us to model at the individual level, proposing an explanation of an observed processes that could be empirically tested against several dimensions of the dynamics of human reproduction in Norway. Although this does not mean that the set of mechanisms encoded in our model is the only possible explanation of the weakening educational gradient in fertility, we showed that this set of mechanisms can reproduce this process while also matching the evolution of different dimensions of the reproductive process in the context and time period of our study.
We believe that this approach has enormous potential for a wide range of demographic problems, particularly those that involve the understanding of mechanisms. Although simulation models have a long history in the social sciences, advances in computing technology have removed some of the barriers to their development and usage. More importantly, parallel breakthroughs in computational statistics have provided robust statistical frameworks that enable inference in large simulation models, allowing simulation models to transcend their theoretical nature and be used for empirical study of the mechanisms behind observed events.
Supplemental Material
Download PDF (83.1 KB)Disclosure statement
No potential conflict of interest was reported by the authors.
Notes
1 Daniel Ciganda is based at the Max Planck Institute for Demographic Research (MPIDR), Germany, and also at the Statistics Institute, UDELAR, Uruguay. Angelo Lorenti is based at MPIDR. Lars Dommermuth is based in the Research Department of Statistics Norway.
2 Please direct all correspondence to Daniel Ciganda, Max Planck Institute for Demographic Research, Konrad-Zuse-Str. 1, Rostock 18057, Germany; or by E-mail: [email protected].
3 Funding: This work was funded by Norges Forskningsråd (Research Council of Norway), grant number 287634.
4 Acknowledgments: We would like to thank Øystein Kravdal for his insightful comments on an earlier version of our manuscript.
References
- Ahn, Namkee and Pedro Mira. 2002. A note on the changing relationship between fertility and female employment rates in developed countries, Journal of Population Economics 15(4): 667–682. https://doi.org/10.1007/s001480100078
- Beaumont, Mark A. 2010. Approximate Bayesian computation in evolution and ecology, Annual Review of Ecology, Evolution, and Systematics 41(1): 379–406. https://doi.org/10.1146/annurev-ecolsys-102209-144621
- Beaumont, Mark A. 2019. Approximate Bayesian computation, Annual Review of Statistics and its Application 6(1): 379–403. https://doi.org/10.1146/annurev-statistics-030718-105212
- Becker, G. S. 1960. An economic analysis of fertility, in G. B. Roberts (ed.), Demographic and Economic Change in Developed Countries. Columbia: Columbia University Press, pp. 209–240. http://www.nber.org/chapters/c2387
- Becker, Gary S. and H. Gregg Lewis. 1973. On the interaction between the quantity and quality of children, Journal of Political Economy 81(2, Part 2): S279–S288. https://doi.org/10.1086/260166
- Becker, Gary S. and Nigel Tomes. 1976. Child endowments and the quantity and quality of children, Journal of Political Economy 84(4, Part 2): S143–S162. https://doi.org/10.1086/260536
- Berrington, Ann and Serena Pattaro. 2014. Educational differences in fertility desires, intentions and behaviour: A life course perspective, Advances in Life Course Research 21: 10–27. https://doi.org/10.1016/j.alcr.2013.12.003
- Berrington, Ann, Juliet Stone, and Éva Beaujouan. 2015. Educational differences in timing and quantum of childbearing in Britain: A study of cohorts born 1940–1969, Demographic Research 33(26): 733–764. https://doi.org/10.4054/DemRes.2015.33.26
- Bongaarts, John. 1990. The measurement of wanted fertility, Population and Development Review 16(3): 487–506. https://doi.org/10.2307/1972833
- Bongaarts, John. 1997. Trends in unwanted childbearing in the developing world, Studies in Family Planning 28(4): 267–277. https://doi.org/10.2307/2137858
- Bongaarts, John. 2001. Fertility and reproductive preferences in post-transitional societies, Population and Development Review 27(Supplement: Global Fertility Transition): 260–281. https://www.jstor.org/stable/3115260
- Bongaarts, John. 2003. Completing the fertility transition in the developing world: The role of educational differences and fertility preferences, Population Studies 57(3): 321–335. https://doi.org/10.1080/0032472032000137835
- Bongaarts, John and Robert E. Potter. 1983. Fertility, Biology, and Behavior: An Analysis of the Proximate Determinants. New York: Academic Press.
- Boonstra, Heather D., Rachel Benson Gold, Cory L. Richards, and Lawrence B. Finer. 2006. Abortion in Women’s Lives. New York: Guttmacher Institute.
- Caltabiano, Marcantonio, Maria Castiglioni, and Alessandro Rosina. 2009. Lowest-low fertility: Signs of a recovery in Italy, Demographic Research 21(23): 681–718. https://doi.org/10.4054/DemRes.2009.21.23
- Castiglioni, Maria, Gianpiero Dalla Zuanna, and Marzia Loghi. 2001. Planned and unplanned births and conceptions in Italy, 1970–1995, European Journal of Population 17(3): 207–233. https://doi.org/10.1023/A:1011810602552
- Ciganda, Daniel and Nicolas Todd. 2022. Demographic models of the reproductive process: Past, interlude, and future, Population Studies 76(3): 495–513. https://doi.org/10.1080/00324728.2021.1959943
- Coale, Ansley J. and T. James Trussell. 1974. Model fertility schedules: Variations in the age structure of childbearing in human populations, Population Index 40(2): 185–258. https://doi.org/10.2307/2733910
- Cochrane, Susan Hill. 1979. Fertility and Education: What Do We Really Know? Baltimore, MD: The Johns Hopkins University Press.
- Dancik, Garrett M. and Karin S. Dorman. 2008. Mlegp: Statistical analysis for computer models of biological systems using R, Bioinformatics 24(17): 1966–1967. https://doi.org/10.1093/bioinformatics/btn329
- De Wachter, David and Karel Neels. 2012. Educational differentials in fertility intentions and outcomes: Family formation in Flanders in the early 1990s, Vienna Yearbook of Population Research 9: 227–258. https://doi.org/10.1553/populationyearbook2011s227
- Doepke, Matthias. 2015. Gary Becker on the quantity and quality of children, Journal of Demographic Economics 81(1): 59–66. https://doi.org/10.1017/dem.2014.8
- Easterlin, Richard A. and Eileen M. Crimmins. 1985. The Fertility Revolution: A Supply-Demand Analysis. Chicago: University of Chicago Press.
- Esping-Andersen, Gøsta and Francesco C. Billari. 2015. Re-theorizing family demographics, Population and Development Review 41(1): 1–31. https://doi.org/10.1111/j.1728-4457.2015.00024.x
- Finer, Lawrence B. and Stanley K. Henshaw. 2006. Disparities in rates of unintended pregnancy in the United States, 1994 and 2001, Perspectives on Sexual and Reproductive Health 38(2): 90–96. https://doi.org/10.1363/3809006
- Galor, O. 2012. The demographic transition: Causes and consequences. IZA Discussion Paper No. 6334. http://doi.org/10.2139/ssrn.2003667
- Goldscheider, Frances, Eva Bernhardt, and Trude Lappegård. 2015. The gender revolution: A framework for understanding changing family and demographic behavior, Population and Development Review 41(2): 207–239. https://doi.org/10.1111/j.1728-4457.2015.00045.x
- Golovina, Kateryna, Natalie Nitsche, Venla Berg, Anneli Miettinen, Anna Rotkirch, and Markus Jokela. 2023. Birth cohort changes in fertility ideals: Evidence from repeated cross-sectional surveys in Finland, European Sociological Review 2023: jcad048. https://doi.org/10.1093/esr/jcad048
- Gutmann, Michael U. and Jukka Corander. 2016. Bayesian optimization for likelihood-free inference of simulator-based statistical models, The Journal of Machine Learning Research 17(1): 4256–4302. http://jmlr.org/papers/v17/15-017.html
- Hartnett, Caroline Sten and Alison Gemmill. 2020. Recent trends in U.S. childbearing intentions, Demography 57(6): 2035–2045. https://doi.org/10.1007/s13524-020-00929-w
- Heckman, James J. and Robert J. Willis. 1976. Estimation of a stochastic model of reproduction: An econometric approach, in N. E. Terleckyj (ed.), Household Production and Consumption. Chicago: National Bureau of Economic Research, pp. 99–146. http://www.nber.org/chapters/c3961
- Henshaw, Stanley K. 1998. Unintended pregnancy in the United States, Family Planning Perspectives 30(1): 24–29+46. https://doi.org/10.2307/2991522
- HMD. 2015. Human Mortality Database. Max Planck Institute for Demographic Research (Germany), University of California, Berkeley (USA), and French Institute for Demographic Studies (France). Available: www.mortality.org (data downloaded on May 2015).
- Hoem, Britta and Jan M. Hoem. 1989. The impact of women’s employment on second and third births in modern Sweden, Population Studies 43(1): 47–67. https://doi.org/10.1080/0032472031000143846
- Human Fertility Database. 2011. Max Planck Institute for Demographic Research (Germany) and Vienna Institute of Demography (Austria). Available at www.humanfertility.org
- Jones, Larry E., Alice Schoonbroodt, and Michèle Tertilt. 2010. Fertility theories: Can they explain the negative fertility-income relationship?, in J. B. Shoven (ed.), Demography and the Economy. Chicago: University of Chicago Press, pp. 43–100.
- Kravdal, Øystein. 1992. The emergence of a positive relation between education and third birth rates in Norway with supportive evidence from the United States, Population Studies 46(3): 459–475. https://doi.org/10.1080/0032472031000146456
- Kravdal, Øystein. 2001. The high fertility of college educated women in Norway: An artefact of the separate modelling of each parity transition, Demographic Research 5(6): 187–216. https://doi.org/10.4054/DemRes.2001.5.6
- Kravdal, Øystein and Ronald R. Rindfuss. 2008. Changing relationships between education and fertility: A study of women and men born 1940 to 1964, American Sociological Review 73(5): 854–873. https://doi.org/10.1177/000312240807300508
- Kreyenfeld, Michaela. 2002. Time-squeeze, partner effect or self-selection?: An investigation into the positive effect of women’s education on second birth risks in West Germany, Demographic Research 7(2): 15–48. https://doi.org/10.4054/DemRes.2002.7.2
- Kulkarni, Sumati and Minja Kim Choe. 1998. Wanted and Unwanted Fertility in Selected States of India. National Family Health Survey Subject Reports, Number 6. Mumbai, India: International Institute for Population Sciences.
- Leridon, Henry. 2004. Can assisted reproduction technology compensate for the natural decline in fertility with age? A model assessment. Human reproduction 19(7): 1548–1553. https://doi.org/10.1093/humrep/deh304
- Luci-Greulich, Angela and Olivier Thévenon. 2014. Does economic advancement ‘cause’ a re-increase in fertility? An empirical analysis for OECD countries (1960–2007), European Journal of Population 30(2): 187–221. https://doi.org/10.1007/s10680-013-9309-2
- Merz, Eva-Maria and Aart C. Liefbroer. 2017. Cross-national differences in the association between educational attainment and completed fertility. Do welfare regimes matter?, Vienna Yearbook of Population Research 15: 95–120. https://doi.org/10.1553/populationyearbook2017s095
- Mode, Charles J. 1985. Stochastic Processes in Demography and Their Computer Implementation. Biomathematics Volume 14. Berlin: Springer Verlag.
- Murphy, Michael. 1993. The contraceptive pill and women’s employment as factors in fertility change in Britain 1963–1980: A challenge to the conventional view, Population Studies 47(2): 221–243. https://doi.org/10.1080/0032472031000146986
- Musick, Kelly, Paula England, Sarah Edgington, and Nicole Kangas. 2009. Education differences in intended and unintended fertility, Social Forces 88(2): 543–572. https://doi.org/10.1353/sof.0.0278
- Myrskylä, Mikko, Hans-Peter Kohler, and Francesco C. Billari. 2009. Advances in development reverse fertility declines, Nature 460(7256): 741–743. https://doi.org/10.1038/nature08230
- R Core Team. 2020. R: A Language and Environment for Statistical Computing. Vienna, Austria: R Foundation for Statistical Computing. Available: https://www.r-project.org/
- Régnier-Loilier, Arnaud, Henri Leridon, and Fabrice Cahen. 2007. Four decades of legalized contraception in France: An unfinished revolution?, Population & Sociétés 439(10): 1–8. https://doi.org/10.3917/popsoc.439.0001
- Rindfuss, Ronald R. and Karin L. Brewster. 1996. Childrearing and fertility, Population and Development Review 22: 258–289. https://doi.org/10.2307/2808014
- Sobotka, Tomáš and Éva Beaujouan. 2014. Two is best? The persistence of a two-child family ideal in Europe, Population and Development Review 40(3): 391–419. https://doi.org/10.1111/j.1728-4457.2014.00691.x
- Sobotka, Tomáš, Éva Beaujouan, and Jan Van Bavel. 2017. Introduction: Education and fertility in low-fertility settings, Vienna Yearbook of Population Research 15: 1–16. https://doi.org/10.1553/populationyearbook2017s001
- Statistics Norway. 2011. Family and Occupation Survey, 1988, female sample (Dataset). Norwegian Social Science Data Services. https://doi.org/10.18712/NSD-NSD0195-1-V1
- Testa, Maria Rita. 2014. On the positive correlation between education and fertility intentions in Europe: Individual- and country-level evidence, Advances in Life Course Research 21: 28–42. https://doi.org/10.1016/j.alcr.2014.01.005
- The Norwegian Tax Administration. 2023. National Insurance Scheme Basic Amount. Available: https://www.skatteetaten.no/en/rates/national-insurance-scheme-basic-amount/ (accessed: 20 December 2023).
- Willekens, Frans. 2017. Continuous-Time Microsimulation in Longitudinal Analysis. In New Frontiers in Microsimulation Modelling, pp. 413–436. New York: Routledge.
- Wulf, Deirdre. 1982. Low fertility in Europe: A report from the 1981 IUSSP meeting, Family Planning Perspectives 14(5): 264–270. https://doi.org/10.2307/2134883
- Zeman, Kryštof, Zuzanna Brzozowska, Tomáš Sobotka, Éva Beaujouan, and Anna Matysiak. 2014. Cohort Fertility and Education Database. Methods Protocol. Available: https://www.eurrep.org/wp-content/uploads/EURREP_Database_Methods_Protocol_Dec2014.pdf (accessed: 20 December 2023).
Appendix
A1. Family size preferences
The desired family size Di of woman i in the simulation is formed immediately after a union is established and is obtained by rounding to the nearest integer a number drawn from a truncated Gamma distribution with expected value:
(1)
(1) where t[i] is the time at union formation for woman i, and
is the average desired family size for all women of reproductive age at time t[i].
represents the existing social norm regarding the ideal family size at a given time. The amount by which EG departs from this norm is given by (−1)wi · (1 – pt[i]) · δ, where wi is a dummy variable that indicates the labour force status of woman i (0 = inactive, 1 = active), pt[i] is the proportion of women in the population who share her labour force participation status, and δ is therefore the maximum proportional departure from the norm. The implication of the (1 – pt[i]) term is that the larger the fraction of the population who share the labour force participation status of woman i, the closer to the existing social norm her preferences will be. For instance, in the extreme case of a homogeneous population of inactive women, the deviation from the norm is zero if newly cohabiting woman i is inactive and is equal to δ if she is active.
As the share of women participating in the labour market increases preferences will decline, stabilizing as this transition nears its end.
The choice of Gamma is based on our own analyses of family size preference data from the Integrated Value Surveys programme. The empirical distributions analysed tend to be positively skewed, with the mode in the 1–3 range, depending on the country and the period, and a right tail formed by a decreasing number of responses associated with larger family sizes. Based on these analyses we fix the scale parameter of the Gamma distribution at 0.1 and truncate it at a maximum number of six children, which captures most of the variation in preferences in the context of our study.
A2. Intentions
While the desired family size Di determines the attempted final parity, the intention Ii,t plays a role in determining the timing and likelihood of each specific birth. More specifically, the intention Ii,t is the probability that a couple will decide to try to have a child in the next year. The strength of the intention depends not only on individual, fixed characteristics but also on the time elapsed since the previous birth.
For a couple who have achieved their desired family size, Ii,t = 0. Otherwise, the intention is given by:
(2)
(2) where βi is a baseline that represents the probability of deciding to have a child in a given year for a non-working woman who has not had a child recently and has not yet achieved her desired family size.
For working women, the intention also depends on education through ωi, which we define as:
(3)
(3) The expression in equation (3) implies that actively participating in the labour market results in penalty η on the intention Ii,t, but it also implies that this penalty is reduced by education. The speed at which the penalty is reduced is given by ε. Larger values of τ imply that more years of education (yi) are needed to reduce the penalty. A very large value of τ implies there is no positive effect of education on the intention to have a child.
Finally, the last term in equation (2) represents a penalty on the intention that decays with the time elapsed since the last birth di,t, with rate λ.
A3. Conception risks
The risk of conception is represented in the model through the notion of fecundability. In the absence of contraception, fecundability is highest among young couples and decreases with age as the frequency of intercourse and the biological capacity to conceive decline.
Fecundability is defined in continuous terms as the instantaneous risk of conception, and it is assumed to be constant in the interval, which implies exponentially distributed waiting times to conception:
(4)
(4) The value of ϕ is fixed at 0.22 mo−1, the maximum instantaneous fecundability, so as to obtain a 0.93 probability of conceiving within a year ( = 1 − e−12·ϕ). This corresponds to a monthly fecundability of 0.20 ( = 1−e−ϕ), a value consistent with what has been reported in the literature for non-contracepting young couples (Bongaarts and Potter Citation1983; Leridon Citation2004). Equation (4) specifies that instantaneous fecundability decreases with rate κ as the age xi of woman i starts to approach age γ. The values for κ and γ were calibrated to fit the pattern of the evolution of fecundability by age proposed by Coale and Trussell (Citation1974).
If the partners decide not to have a child in the next 12 months, they will be at risk of an unplanned conception during this period due to residual fecundability, defined as:
(5)
(5) where ci,t ∈ [0, 1] represents the fecundability-reducing effect (effectiveness) of the contraceptive methods available to woman i at time t, and ci,t = 0 represents perfect effectiveness, while ci,t = 1 means complete ineffectiveness. Equation (6) shows that ci,t is defined by:
(6)
(6) For a given educational attainment level (fixed yi), the evolution of ci,t through calendar time is simply a decreasing logistic function with maximum value (ρ/yi)α, inflection point ψ − yi, and steepness r, to which is added a constant υ, the effectiveness of the best contraceptive methods. This definition reflects the notion that while the effectiveness of contraceptive methods improves over time for all women, better educated women more readily adopt efficient contraceptive methods.
Finally, the last term in equation (5), ai is equal to one if couple i have not yet achieved their desired family size and fixed value a if the couple have already achieved their desired family size. The assumption here is that the partners will intensify their efforts to prevent additional births after they have reached their goal.
If the waiting time until conception (planned or unplanned) CT is shorter than 12 months, a waiting time until birth BT is created by adding 270 days of gestation to CT . Following the birth, there will be a period of six months that corresponds to the period of postpartum subfecundity, abstinence, and increased contraceptive use with the aim of avoiding dangerously close births. After this period of time, the couple will go back to being exposed to the risk of a new conception.
If no conception occurs within the next 12 months, our couple will update their intentions again at the end of that period. Thus, the partners will either decide to try to have a child in the next year or they will be subject to the risk of an unplanned birth.
A4. Age at union formation
To keep things simple, the preferences, intentions, and risks that control the process described so far are assumed to operate only after the formation of a cohabitation union. The age at which this event occurs is therefore of considerable importance. We follow previous studies that have successfully approached the empirical distribution in the age at marriage using the log-normal distribution (Mode Citation1985):
(7)
(7) where µi is given by the age at which woman i completes her education plus a parameter ξ which represents the average waiting time (in years) to the formation of a cohabiting union after the end of the schooling period.
A5. Death
The waiting time until death is sampled using the inverse distribution function method (for a description of the method see Willekens Citation2017), where the distribution of waiting times until death is reconstructed using age-specific cohort mortality rates available at HMD (Citation2015).
A6. Pseudocode
The pseudocode shown in Box 1 describes the basic operation of the Comfert algorithm. The entire process is described by four events: starting a cohabiting union, considering whether to have a child, having a child, and death.
Box 1 The Comfert algorithm
Table
A7. Estimated parameter values
Table A1 Model parameters and best-fitting values: Norway
The β parameter represents the baseline for the intention to have a child (for those who still have not achieved their desired family size). As explained earlier, the model considers a set of factors that reduce this intention, for example the proximity of a previous birth or the fact that both parents work. The baseline intention β was set a value lower than one to consider other factors that might impose a penalty on the intention and that are not explicitly modelled in our approach. It is important to note that the value of the parameters that imply reductions in the baseline, λ and η, are relative to the value of β.
Some of the quantities involved in the model are well researched. This is the case for fecundability and its age pattern, as represented by parameters ϕ, γ, and κ which were derived from the scheduled developed by Coale and Trussell (Citation1974). Using these existing estimates to fix the values of these quantities allows us to reduce the dimensionality of the parameter space, improving the performance of the estimation algorithm. We also fixed some quantities that showed less variation or less influence on the results during our preliminary estimation attempts. This is the case for λ, ε, and A.