
Abstract
Purpose: According to the principles of programmatic assessment, a valid high-stakes assessment of the students’ performance should amongst others, be based on a multiple data points, supposedly leading to saturation of information. Saturation of information is generated when a data point does not add important information to the assessor. In establishing saturation of information, institutions often set minimum requirements for the number of assessment data points to be included in the portfolio.
Methods: In this study, we aimed to provide validity evidence for saturation of information by investigating the relationship between the number of data points exceeding the minimum requirements in a portfolio and the consensus between two independent assessors. Data were analyzed using a multiple logistic regression model.
Results: The results showed no relation between the number of data points and the consensus. This suggests that either the consensus is predicted by other factors only, or, more likely, that assessors already reached saturation of information. This study took the first step in investigating saturation of information, further research is necessary to gain in-depth insights of this matter in relation to the complex process of decision-making.
Introduction
In competency-based education, emphasis has shifted toward outcomes, capabilities, and learner-centeredness (Frank and Danoff Citation2007; Frank et al. Citation2010; Holmboe et al. Citation2010; Frank et al. Citation2017). This shift called for new methods of teaching and assessment. Van der Vleuten et al. (Citation2012) proposed a theoretical model of programmatic assessment. Programmatic assessment aims to optimize the learning and certification function of an assessment program. This is ensured by applying multiple low-stakes data points over a longer period of time. Each data point is maximally informative for learning. By aggregating these low-stakes data points a final high-stakes decision can be made. In high-stakes programmatic assessment, assessors combine quantitative and qualitative information in a portfolio into a holistic judgment (van der Vleuten et al. Citation2012). This judgment should amongst others be based on multiple data points (Schuwirth et al. Citation2002; van der Vleuten and Schuwirth Citation2005; van der Vleuten et al. Citation2015). Multiple data points contribute to the generation of reliable and valid information, resulting in a full picture of the student’s clinical performance (van der Vleuten et al. Citation2012). Therefore, to ensure high quality of a program of assessment the validity of this claim needs to be evaluated. Consistent with the argument-based approach by Kane, validity can be regarded as a series of inferences which must be supported by sufficient evidence (Kane Citation2006; Cook et al. Citation2015). Since high-stakes assessment in programmatic assessment involves longitudinal data from various assessment methods, validity should be evaluated on the level of the program of assessment rather than on the level of one single assessment method (van der Vleuten et al. Citation2010). Therefore, Schuwirth and colleagues provided an overview of arguments involved in a programmatic program of assessment (Schuwirth and van der Vleuten Citation2012). In this overview, the claim of a high-stakes assessment to be based on multiple low-stakes data points is described as the construct of saturation of information within the generalization inference. Saturation of information is attained when a new observation does not add important information regarding the students’ performance (Schuwirth and van der Vleuten Citation2012). In a program of assessment, institutions often quantitatively warrant saturation of information by setting a minimum requirement for the number of data points to be included in a portfolio (Driessen et al. Citation2012; Bok et al. Citation2013b). So far, no studies have investigated the number of data points as part of saturation of information. In this study, we aimed to provide initial quantitative evidence for saturation of information in portfolio assessment within a programmatic approach. We investigated the relationship between the number of data points exceeding the minimum requirements and the consensus between assessors when making a judgment about the portfolio. In concordance with the construct of saturation of information, we hypothesize that the more data points, the fuller picture of the student can be created, leading to higher agreement.
Methods
Assessment program
At the Faculty of Veterinary Medicine, Utrecht University, the Netherlands (FVMU) students in their final years predominantly learn at the clinical workplace through clerkships. During these clerkships, the focus lies on three main differentiations: Companion animal health, equine sciences, and farm animal health. Assessment takes place with use of multiple workplace-based assessment tools: Clinical evaluation exercises (mini-CEXs), evidence-based case reports (EBCRs), and multi-source feedback forms (MSFs). These tools are designed to combine scores (quantitative information) with narrative feedback (qualitative information) provided by supervisors, peers, patient owners, and others. Students collect multiple workplace-based assessment tools from multiple assessors in different contexts over a longer period of time. Simultaneously, students reflect on the received feedback in personal development plans. Altogether, this generates multiple low-stakes data points which are recorded in an e-portfolio. To monitor the students’ progress a mentor is assigned. The mentor performs biannual informative intermediate assessments and discusses their findings with the student. High-stakes summative assessment takes place twice during the clerkships: after the first two years and after the final third year. In this high-stakes assessment, two assessors, who are part of a portfolio examination committee, are randomly assigned to assess an e-portfolio. All members from the portfolio examination committee are senior employees at FVMU and are trained in assessing e-portfolios. In assessing the portfolio, the assessor assesses each competency by providing a grade on a 1–5 scale complemented with narrative comments of their findings. At the end of the rubric, the assessor reports the strengths and weaknesses of the students’ performance. Each assessor independently grades the e-portfolio on a scale from 4 to10 (6 or higher means “pass” (ten Cate et al. Citation2006). When grades differ (one-point difference or more), a third assessor assesses the e-portfolio to reach consensus regarding the final score. The assessment program as described above has been implemented since 2010 in accordance with the principles of programmatic assessment (Bok et al. Citation2013b).
Study design
In this study, we used the number of mini-CEXs from supervisors in the e-portfolio for the first high-stakes assessment as a proxy variable for the number of data points. We used this proxy variable because in our experience the number of mini-CEXs from supervisors is the most distinctive parameter of the number of data points for two reasons. First, we think assessors regard Mini-CEX as an important source of information. Second, the mini-CEX is the most frequently applied workplace-based assessment tool at the FVMU program. Since the minimum requirements for the Mini-CEX in our sample varied between 12 and 16, the number of mini-CEXs of each student was adjusted for the minimum requirements. This was necessary to compare the number of mini-CEXs among students. For instance, a portfolio including 20 mini-CEXs with a minimum requirement of 14 was recorded as containing 6 mini-CEXs. The mini-CEX as designed for our veterinary program consists of scores on a 1–5 scale, including an informative rubric for each competency domain. Competency domains are based upon the Veterinary Professional (VetPro) framework (Bok et al. Citation2011) and consist of collaboration, communication, health and welfare, entrepreneurship, personal development, scholarship, and veterinary expertise. Next, to that, several boxes are included to provide narrative feedback (overall and for the competencies).
Participants
Students were selected based on five criteria. First, they had received a final grade for their first high-stakes assessment. Second, the first students (n = 52) after introduction of the new program of assessment were removed, since we considered them as a pilot group. Third, students who collected less than the minimum requirements for the mini-CEXs were excluded: according to the exam regulations this inevitably should lead to a “fail” (grade = 5) decision and thus agreement. Fourth, since the exam regulation of failing to meet the minimum requirements concerns the other workplace-based assessment tools as well, all students whose e-portfolio was graded with a five were removed. Fifth, the students who remediated at the time of data collection were excluded, since the remediation procedure is individual and does not necessarily has an effect on the number of data points.
Statistical analysis
Data were analyzed using R, version 3.4.1 (2017-06-30) (R Core Team Citation2016). First, descriptive analyses were performed, for instance: mean, median, and standard deviation of the final score and number of data points, histograms, and a frequency table. To analyze the overall consensus between the assessors we used two interrater agreement indexes: percentage of interrater agreement (IRA) and interrater reliability (IRR, package “IRR”). We used both the IRA and IRR to give a full impression of the consensus between assessors. Furthermore, in providing additional evidence for internal validity of the study design the degree of strictness in rating of each assessor was determined by averaging the given grades. A multiple logistic regression model was built to analyze the relationship between the number of data points and agreement between assessors, including the time of assessment and the chosen differentiation of species (companion animal health, equine sciences, and farm animal health)× number of data points (interaction term) as covariates. These covariates were chosen for practical reasons since in the context of our veterinary program these could be possible confounding factors. To model the data, the covariates were transformed into dummy variables and the assumptions of multiple logistic regression were checked: linearity of the logit and independence of errors (Durbin–Watson test). Furthermore, multicollinearity was checked using the variance inflation factor (VIF; package “rms”). The variables for the final model were selected with stepwise backward selection based on the Akaike information criterion (AIC) (Zhang Citation2016). Additionally, a simple logistic regression model was built including only the number of data points and the agreement between assessors as variables.
Ethical considerations
The Ethical Review Board of the Dutch Association for Medical Education (NVMO-ERB) approved this study (file number: 980).
Results
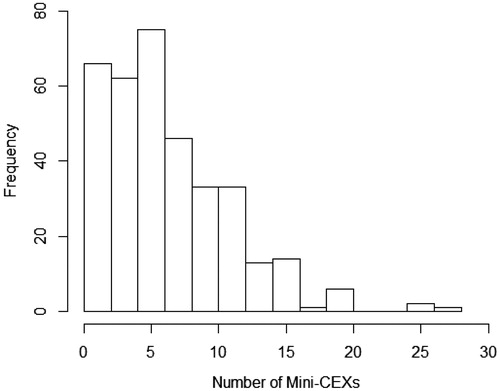
From the 463 available students, 352 students were included in this study: 200 Companion Animal Health students, 99 Farm Animal Health students, and 53 Equine sciences students. Together they collected 7110 mini-CEXs of which 2340 mini-CEXs exceeded the minimum requirements. The first group of students was assessed from 1 October 2013 and the last group from 15 January 2016. The median collected mini-CEXs above the minimum requirements was 6.0 (interquartile range (IQR)=6.0) ().
Figure 1. Histogram of the frequency of the number of collected mini-CEXs exceeding the minimum requirements.
The portfolios (n = 352) were assessed by 16 different assessors, the standard deviation between assessors was 0.24 indicating the variation in strictness in rating, while the variation in the number of assessments was SD = 24.7 ().
Table 1. Overview of the average given grade including the standard deviation (rounded off on 2 decimals) and the number of high-stakes assessments per assessor.
On average the final score of the portfolio was 7.47 (SD = 0.79), ranging from 4 to 9. Overall, in 86% of the portfolios, the assessors agreed on the final grade IRA. Since in most cases (88%) of disagreement there was a one-point difference between assessors () a unweighted Cohen’s kappa was used for calculating the IRR; IRR = 0.778 (Gisev et al. Citation2013). In 51 portfolio’s there was disagreement amongst the first two assessors.
Table 2. Frequency table of the given high-stakes grades by the assessors.
The assumptions for the multiple logistic regression model were met: non-significant logit interaction term (p= 0.74) and independence of errors (Durbin–Watson (D–W) statistic = 2.052). Even though the VIF value (VIF > 10) for the interaction term indicated collinearity within the data, the low standard error suggested this was not problematic. The sample size of n = 352 was sufficient to detect medium differences (Miles and Shevlin Citation2001). The stepwise method (backward) based on the AIC resulted in a final model including no predictors. Furthermore, the simple model did not significantly (p> 0.05) improve the model compared to a model with no predictors: χ2 (1)=1.34; p= 0.25; 95% confidence interval odds ratio: 0.97–1.10.
Discussion
The multiple logistic regression analysis resulted in a final logistic regression model with no predictors included. Besides that, the simple logistic regression model showed no significant improvement of fit. Thus, an increased number of data points did not predict the consensus between assessors. This might imply that the degree of consensus is not related to the number of data points at all, but to other predictors we did not investigate in this study such as the use of a small group of trained assessors and the use of rubrics (Driessen et al. Citation2007). However, since previous studies suggested that reliable information is generated by multiple data points (van der Vleuten et al. Citation2012; Moonen-van Loon et al. Citation2013) and the descriptive analysis found that the overall IRR and IRA were substantial (Landis and Koch Citation1977) and high, we think it seems more plausible that the assessors of the portfolio reached saturation of information and an excess number of data points did not contribute to higher consensus.
This study investigated the quantity of data points in saturation of information applying a reductionist approach to a more complex phenomenon for two reasons. First, with respect to the summative decision-making function in programmatic assessment, a data point provides more information than its frequency alone. Its content (both qualitative and qualitative information) is important as well, in which each data point is part of the complete “picture” of multiple assessments from different methods, contexts and various raters (van der Vleuten and Schuwirth Citation2005; van der Vleuten et al. Citation2012; van der Vleuten et al. Citation2015). Second, in this study, the notion saturation of information is quantified by measuring agreement between assessors, but since saturation of information originates from qualitative research methodologies, a more qualitative approach investigating the assessors’ perception is relevant as well. This perception is embedded in even a more complex process of decision-making. Previous research showed that decision-making in portfolio assessment consists of a 3-phase cyclical process of acquiring, organizing, and integrating information (Pool et al. Citation2018). Saturation of information expectedly should take place in the acquiring phase. Therefore not only the outcome of the decision-making process (consensus between assessors) should be investigated, but gaining more in-depth insights in the complex relation between saturation of information and portfolio decision-making processes is relevant as well. The next step in providing validity evidence for saturation of information in programmatic assessment could be investigated by studying the effect of the content of data points on saturation of information and its relation with the decision-making process.
Our findings also revealed that generally the students collect more mini-CEXs than they should have according to the minimum requirements. This is meaningful since the generation of the data points is an implicit requisite for reliable and valid portfolio assessment. Previous research found that their feedback-seeking behavior is influenced by their perceived costs and benefits (Bok et al. Citation2013a), furthermore high performing students seem to be more motivated in seeking feedback compared to low performing students and predominantly show autonomous motivation in seeking feedback (de Jong et al. Citation2017). Thus not only the institution determines the quantity of data points in the portfolio, but the student itself has great influence as well, resonating with the notion of the validity residing in the users (van der Vleuten et al. Citation2012).
Strengths and limitations
To our knowledge, this was the first study which investigated the claim of saturation of information in a competency-based programmatic program of assessment. The large dataset and the independent assessment of the portfolios by two assessors made it possible to explore it. Three main limitations should be addressed. First, due to the minimum requirements for the number of mini-CEXs to be included in the portfolio, we could only examine the excess number of mini-CEXs. This might imply that the proxy used is an invalid indicator. Second, since there were major variations in number of portfolios assessed by each assessor, the strictness in rating of the assessor could not be expressed as a quantitative score and therefore strictness as a covariate was not included in the multiple logistic regression model. In an attempt to overcome this problem we decided to include a table to illustrate the variation in given grades between assessors. Third, this study is performed in a specific context making it more difficult to generalize the results.
Conclusions
Can we provide evidence for saturation of information in a portfolio? In this study, the relation between the number of data points exceeding the minimum requirements and the consensus between assessors is used as a first step in answering this question. The results showed no relation between these variables, suggesting that either the consensus is predicted by other factors only, or, more likely, that assessors already reached saturation of information.
Acknowledgments
The authors would like to thank Dr. Hans Vernooij for statistical advice.
Disclosure statement
The authors report no conflicts of interest. The authors alone are responsible for the content and writing of this article.
Glossary
Generalization inference: One of the inferences in the Kane’s validity framework involving from observed score to universe score.
Kane MT. 2006. Validation. In: Brennan RI, editor. Educational Measurement. 4th ed. p. 17–64. Westport: ACE, Praeger.
Cook DA, Brydges R, Ginsburg S, Hatala R. 2015. A contemporary approach to validity arguments: a practical guide to Kane’s framework. Med Educ. 49(6):560–575.
Additional information
Notes on contributors
Lubberta H. de Jong
L. H. de Jong, MSc DVM, is a PhD candidate at the Centre of Quality Improvement in Veterinary Education, Faculty of Veterinary Medicine, Utrecht University, Utrecht, The Netherlands.
Harold G. J. Bok
H. G. J. Bok, PhD DVM, is an assistant professor at the Centre of Quality Improvement in Veterinary Education, Faculty of Veterinary Medicine, Utrecht University, Utrecht, The Netherlands.
Wim D. J. Kremer
W. D. J. Kremer, PhD, DVM, is the director of education/vice dean of Education. He is also professor of Farm Animal Health in particular Education, Faculty of Veterinary Medicine, Utrecht University, Utrecht, The Netherlands.
Cees P. M. van der Vleuten
C. P. M. van der Vleuten, PhD, is a professor of Education, Chair of the Department of Educational Development and Research and director of the School of Health Professions Education, Maastricht University, Maastricht, The Netherlands.
References
- Bok HG, Jaarsma DA, Teunissen PW, van der Vleuten CPM, van Beukelen P. 2011. Development and validation of a competency framework for veterinarians. J Vet Med Educ. 38:262–269.
- Bok HG, Teunissen PW, Spruijt A, Fokkema JP, van Beukelen P, Jaarsma DA, van der Vleuten CPM. 2013a. Clarifying students’ feedback‐seeking behavior in clinical clerkships. Med Educ. 47:282–291.
- Bok HG, Teunissen PW, Favier RP, Rietbroek NJ, Theyse LF, Brommer H, Haarhuis JC, van Beukelen P, van der Vleuten CP, Jaarsma DA. 2013b. Programmatic assessment of competency-based workplace learning: when theory meets practice. BMC Med Educ. 13:123.
- Cook DA, Brydges R, Ginsburg S, Hatala R. 2015. A contemporary approach to validity arguments: a practical guide to Kane’s framework. Med Educ. 49:560–575.
- de Jong LH, Favier RP, van der Vleuten CPM, Bok HG. 2017. Students’ motivation toward feedback-seeking in the clinical workplace. Med Teach. 39:954–958.
- Driessen EW, Van Tartwijk J, Govaerts M, Teunissen P, van der Vleuten CPM. 2012. The use of programmatic assessment in the clinical workplace: a Maastricht case report. Med Teach. 34:226–231.
- Driessen E, Van Tartwijk J, Van Der Vleuten C, Wass V. 2007. Portfolios in medical education: why do they meet with mixed success? A systematic review. Med Educ. 41:1224–1233.
- Frank JR, Danoff D. 2007. The CanMEDS initiative: implementing an outcomes-based framework of physician competencies. Med Teach. 29:642–647.
- Frank JR, Snell LS, Cate OT, Holmboe ES, Carraccio C, Swing SR, Harris P, Glasgow NJ, Campbell C, Dath D, et al. 2010. Competency-based medical education: theory to practice. Med Teach. 32:638–645.
- Frank JR, Snell L, Englander R, Holmboe ES. 2017. Implementing competency-based medical education: moving forward. Med Teach. 39:568–573.
- Gisev N, Bell JS, Chen TF. 2013. Interrater agreement and interrater reliability: key concepts, approaches, and applications. Res Social Adm Pharm. 9:330–338.
- Holmboe ES, Sherbino J, Long DM, Swing SR, Frank JR. 2010. The role of assessment in competency-based medical education. Med Teach. 32:676–682.
- Kane MT. 2006. Validation. In: Brennan RI, editor. Educational Measurement. 4th ed. p. 17–64. Westport: ACE, Praeger.
- Landis JR, Koch GG. 1977. The measurement of observer agreement for categorical data. Biometrics. 33:159–174.
- Miles J, Shevlin M. 2001. Applying regression and correlation: a guide for students and researchers. Thousand Oaks (CA): Sage.
- Moonen-van Loon J, Overeem K ,Donkers H ,Van der Vleuten C, Driessen E. 2013. Composite reliability of a workplace-based assessment toolbox for postgraduate medical education. Adv Health Sci Educ. 18:1087–1102.
- Pool AO, Govaerts MJ, Jaarsma DA, Driessen EW. 2018. From aggregation to interpretation: how assessors judge complex data in a competency-based portfolio. Adv Health Sci Educ Theory Pract. 23:275–287.
- R Core Team. 2016. R: a language and environment for statistical computing. Vienna: R Core Team.
- Schuwirth L, Southgate L, Page G, Paget N, Lescop J, Lew S, Wade W, Baron-Maldonado M. 2002. When enough is enough: a conceptual basis for fair and defensible practice performance assessment. Med Educ. 36:925–930.
- Schuwirth LWT, van der Vleuten CPM. 2012. Programmatic assessment and Kane’s validity perspective. Med Educ. 46:38–48.
- ten Cate TJ, ter Braak E, Frenkel J, van de Pol A. 2006. De 4-tot-10 verwacht niveau-schaal (410VN-schaal) bij persoonlijke beoordelingen. Tijdschrift Med Onderwij. 25:157–163.
- van der Vleuten CPM, Schuwirth LW. 2005. Assessing professional competence: from methods to programmes. Med Educ. 39:309–317.
- van der Vleuten C, Schuwirth L, Driessen E, Dijkstra J, Tigelaar D, Baartman L, van Tartwijk J. 2012. A model for programmatic assessment fit for purpose. Med Teach. 34:205–214.
- van der Vleuten C, Schuwirth L, Driessen E, Govaerts M, Heeneman S. 2015. Twelve tips for programmatic assessment. Med Teach. 37:641–646.
- van der Vleuten C, Schuwirth L, Scheele F, Driessen E, Hodges B. 2010. The assessment of professional competence: building blocks for theory development. Best Pract Res Clin Obstet Gynaecol. 24:703–719.
- Zhang Z. 2016. Variable selection with stepwise and best subset approaches. Ann Transl Med. 4:136.