
Abstract
Introduction
Alongside the usual exam-level cut-score requirement, the use of a conjunctive minimum number of stations passed (MNSP) standard in OSCE-type assessments is common practice across some parts of the world. Typically, the MNSP is fixed in advance with little justification, and does not vary from one administration to another in a particular setting—which is not congruent to best assessment practice for high stakes examinations. In this paper, we investigate empirically four methods of setting such a standard in an examinee-centred (i.e. post hoc) and criterion-based way that allows the standard to vary appropriately with station and test difficulty.
Methods and results
Using many administrations (n = 442) from a single exam (PLAB2 in the UK), we show via mixed modelling that the total number of stations passed for each candidate has reliability close to that of the total test score (relative g-coefficient 0.73 and 0.76 respectively). We then argue that calculating the MNSP based on the predicted number of stations passed at the ‘main’ exam-level cut-score (i.e. for the borderline candidate) is conceptually, theoretically and practically preferred amongst the four approaches considered. Further analysis indicates that this standard does vary from administration to administration, but acts in a secondary way, with approximately a quarter of exam-level candidate failures resulting from application of the MNSP standard alone.
Conclusion
Collectively, this work suggests that employing the identified approach to setting the MNSP standard is practically possible and, in many settings, is more defensible than using a fixed number of stations set in advance.
Introduction – Minimum-stations-passed standards
In many OSCE settings, it is common practice to generate the pass/fail cut-score using a criterion-based, examinee-centred method where grades/scores of the actual performance are combined to produce the standard (Cizek and Bunch Citation2007, chap. 2). An example of this approach is borderline regression (McKinley and Norcini Citation2014; Wood et al. Citation2006), and such a method is seen as producing robust and defensible standards in a fully compensatory framework, where good performance in some elements of the exam is allowed to compensate for weaker performance elsewhere (Hijazi and Downing Citation2008). For a range of reasons (Clauser et al. Citation1996; Homer and Russell Citation2020), many institutions and jurisdictions across the world also require candidates to achieve a minimum number of stations passed (MNSP) in the OSCE (General Medical Council Citation2020a; Australian Medical Council Limited Citation2021; General Medical Council Citation2022; The College of Optometrists Citation2022). This limits compensation across stations and is generally set in advance, and is usually fixed across administrations, and so goes against best criterion-based assessment practice (Cizek and Bunch Citation2007, chap. 2) where standards should adjust based on test difficulty. Despite its common usage, for example in medical schools and postgraduate contexts in the UK, Australia and South Africa, there is very little empirical, theoretical or wider consideration of these issues in the medical education, or in the broader assessment literature (Ben-David Citation2000; Clauser et al. Citation1996; Homer and Russell Citation2020).
Practice points
In many OSCE-type assessments, candidates are required to achieve a minimum number of stations in addition to reaching the overall standard-set cut-score.
This minimum station hurdle lacks defensibility as it is usually set in advance, and does not vary with exam difficulty.
Empirical work across a large exam dataset shows that the total number of stations passed in an exam has reliability close to that of the aggregate station score across the exam.
One particular method of stetting the minimum station hurdle, using the predicted minimum stations passed at the exam-level cut-score, is shown to be most defensible.
Standard setting practices in many contexts would very likely be improved by using this method, but implementation should be preceded by careful modelling of the impact on overall pass/fail decisions.
Earlier work discussed the reasons why a MNSP standard can provide additional reassurance to assessment teams about the robustness of their assessment outcomes (Homer and Russell Citation2020). That work also tentatively proposed four potential methods for setting such a standard in a criterion-based way. The current paper develops these ideas, emphasising empirical and practical considerations when evaluating these approaches to setting the MNSP. The overall aim is to provide evidence as to the best (i.e. most defensible) way to set a MNSP standard—that is, one that aligns with good assessment practice—for example, utilising in a purposeful way assessor judgments about the minimally competent (i.e. ‘borderline’) candidate performance (Cizek and Bunch Citation2007, p. 2).
The paper proceeds as follows: we first outline the assessment context and describe the sample of assessment data used in the empirical work. We outline the methods used to estimate and compare the reliability of exam-level assessment outcomes (total score and total number of stations passed)—based on the presumption that there is no point in using an unreliable score as an outcome which is then used for classification decisions (pass and fail). We next scrutinise four specific ways of setting an MNSP—considering their relative advantages and disadvantages—both theoretically and practically. Using this evidence, we conclude that one particular method is preferred, and quantify how this standard impacts on overall pass/fail decisions, and how it varies across test administrations. We conclude by providing some final thoughts and recommendations that are intended to improve standard setting practices in this area.
Study assessment context – PLAB2 in the UK
PLAB2 is an 18 station clinical examination that is set at the level appropriate for working in the UK National Health Service (NHS) (General Medical Council Citation2020a, Citation2020b) at the FY2 level (i.e. the second year following graduation). It is taken by international medical graduates who wish to come and work in the NHS, and requires candidates to demonstrate application of medical knowledge in order to provide good care to patients at the level appropriate level.
In each PLAB2 station there is a single examiner awarding a total domain score for each candidate from 0 to 12 across three equally weighted domains (each scored 0 to 4, and present in every station) ((i) Data gathering, technical and assessment skills, (ii) Clinical management skills, and (iii) Interpersonal skills) as well as a global grade scored 0 (Fail), 1 (Borderline), 2 (Satisfactory), or 3 (Good). The cut-score at the station level is set using borderline regression using the total domain scores and global grades in the station (McKinley and Norcini Citation2014; Wood et al. Citation2006). Most stations include a simulated patient (SP) played by a paid actor.
The overall cut-score for the exam is set as the aggregate of the station cut-scores for the exam plus 1 (classical) standard error of measurement (Hays et al. Citation2008). To pass overall, candidates have to achieve the overall cut-score and pass 11 stations out of 18. This latter, conjunctive, standard was set by the PLAB2 panel, a group of 30–40 individuals who are mostly senior clinicians, and who are responsible for general oversight of PLAB2, including the development of new stations and the setting of assessment policy.
PLAB2 examiners receive appropriate training and feedback, and pre-exam calibration between examiners and SPs takes place on the day of the exam. A range of post hoc psychometric analysis of assessment outcomes is carried out in order to evidence assessment quality. For more details of this particular assessment context see, for example, Homer et al. (Citation2020).
Data sample – Candidates, examiners and stations
The PLAB2 candidate level data used in this study was generated over the period when the exam had a consistent format—from November 2016, when the exam was significantly re-organised, to March 2020 when the advent of COVID19 led the exam to be paused temporarily (and later re-started in an adjusted format).
shows the scale of the data used in this paper, with over 18,000 candidates, nearly 900 examiners, and nearly 400 stations across 330,000 candidate/station interactions from 442 separate PLAB2 examinations. Multiple candidate attempts at PLAB2 are included, but in the analysis each attempt is treated as unique (i.e. with a new candidate ID—as candidates tend to improve on each attempt). For each exam, there are typically two sessions per day using the same examiners in the same stations, with a median of 35 candidates per exam.
Table 1. Descriptive statistics for the key facets of the PLAB2 exam (Nov. 2016 to March 2020).
Across the dataset examiners and stations reoccur in a somewhat irregular manner—as the median and quartile data in suggests.
Methods
Reliability of exam level outcomes
We calculate reliability coefficients for total domain score and total number of stations passed across the dataset as a whole. To do this, we first use mixed models and the R package lme4 (Bates et al. Citation2015) to estimate variance components for total domain score in a station, and separately for passing/failing a station (). The model uses only the main effect of candidate, examiner, and station—interactions between facets (e.g. examiner and station) cannot be estimated in this data—there is simply not enough crossover between facets (e.g. the same examiner present in the same stations across different exams). In the modelling, each facet is treated as a random effect—represented in using the notation (1 | RANDOM EFFECT).
Table 2. Outline of main modelling approach for station-level domain scores and pass/fail decisions.
The variance components are used in a generalizability study to produce reliability estimates and standard errors of measurement (Bloch and Norman Citation2012; Jiang Citation2018) taking into account all factors across all exams. The modelling assumes a fixed ability level for each candidate, a fixed difficulty for each station, and a fixed stringency for each examiner—these are necessary limitations of the approach taken.
Four possible methods for setting the minimum stations-passed standard
The four proposed methods for setting the MNSP (M1 to M4), first proposed in Homer and Russell (Citation2020), are outlined briefly in . Further empirical consideration of each method is given in the Results section, where, based on our experience in calculating the MNSP in each of the 442 exams, we discuss the benefits and challenges of each method.
Table 3. Brief overview of each potential method of setting MNSP.
Our evidence will suggest that M4 is the most defensible, and we ultimately focus our empirical work on this method in terms of assessing its contribution to exam-level pass/fail decisions, and consideration of how the standard it produces varies across PLAB2 administrations.
Results
Reliability of exam level outcomes
gives the variance components for domain scores and for pass/fail decisions in each station across the full dataset—the pass/fail outcome is based on the station-level application of the borderline regression cut-score to the total domain score in the station.
Table 4. Variance components for domain scores and pass/fail decision in a station.
The modelling shows that around two-thirds (66.6%) of domain score variance in a station is not accounted for by the three facets. Examiner is the most important facet, accounting for 16%, followed by Candidate (11.6%) and then Station (5.8%). These results are consistent with other work with similar data (Homer Citation2022). For pass/fail decisions, residual variance is closer to three-quarters (72.4%), and Examiner and Candidate proportions are more equal at around 11% each.
The corresponding reliability and SEM estimates using generalizability theory for an 18 station OSCE are shown in —treating all non-candidate facets (i.e. station and examiner) as error.
Table 5. Overall reliability/SEM estimates for an 18 station PLAB2 OSCE.
The data in shows that both the total domain score and the total number of stations passed have acceptable levels of reliability according to the usual guidelines (Streiner et al. Citation2015, chap. 8). It seems there is little published analysis of the reliability of the total number of stations passed (Homer and Russell Citation2020). This analysis provides some confidence that pass/fail classifications are defensible using either of these outcomes.
The four methods for setting minimum station hurdles
We now consider in turn each of the four methods of setting the MNSP ().
M1: MNSP equal to exam-level cut-score percentage
M1 is straightforward to produce via the main standard setting approach (e.g. BRM) and does track test overall difficulty. However, it remains theoretically weak as in its derivation there is no obvious reason why the minimum-stations-passed standard for the borderline candidate should precisely match (in percentage terms) the ‘main’ cut-score produced (either by BRM, or any other method).
M2: MNSP set at the typical number of stations passed by a ‘borderline’ group (at exam level)
This method requires a somewhat arbitrary judgment about exactly where the borderline group in the exam is located. Within ±1 standard error of measurement, there were two exams out of 442 with no such borderline candidates (0.5% of exams), and this increased to 12 exams for the ±0.5 standard error of measurement limits (2.7% of exams). This is a serious drawback to this method—in practice, we obviously need to able to produce the standard for every examination without fail.
M3: MNSP calculated using logistic regression at station level and aggregated to exam level
In this method, we use logistic regression to predict the probability that a candidate with a borderline grade will pass each station. These probabilities are aggregated up to the exam level to produce the M3 standard—this gives the expected proportion of stations passed for a hypothetical candidate who is judged borderline in each station.
Somewhat unexpectedly, there are practical problems with applying this method in approximately 9% of stations in the PLAB2—see the Appendix for more details. As with M2, the failure to always produce a (station level) standard is a serious drawback for M3. However, for a bigger cohort, for example in larger undergraduate exams, these problems might occur less frequently or not at all, and M3 might then become viable. There might also be other ways to overcome some of the problems with M3, but they would undoubtedly add to the complexity of implementation of M3.
M4: MNSP calculated via regression of total no. of stations passed on total score
This method has a similar methodology to borderline regression within stations, but acts at the exam level and uses data from all candidates in the examination. For a particular administration, M4 reflects the modelled number of stations in the exam that the (hypothetical) minimally competent candidate passes. It therefore identifies candidates who might have passed the (BRM) cut-score standard, but have not passed as many stations as the typical borderline candidate (as judged across the exam as a whole).
For further illustration, an example of an M4 calculation from one exam in the PLAB2 data is shown in . The regression modelling of number of stations passed on total domain score in the exam predicts that at the cut-score the typical borderline candidate would pass 9.7 stations implying with rounding that the M4 standard is 10 stations (out of 18). Imposition of this conjunctive standard implies that two additional candidates fail who have passed the BRM cut-score standard (the two red points in bottom right quadrant of ).
Figure 1. Calculation of the M4 standard for a particular examination with 35 candidates.
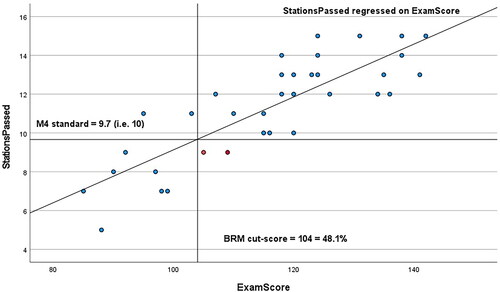
M4 does not require any arbitrary decision as to where the borderline group lies in terms of overall exam score, and uses all the assessment data from the exam in its calculation.
Comparing across the four methods, the evidence so far presented suggests that M4 is theoretically and practically preferred—we have found that M1 is theoretically weak, and that M2 and M3 cannot be guaranteed to always provide a MNSP in every exam without further development of the method.
To complete the analysis, we next investigate the proportion of failing candidates that M4 contributes, and investigate the extent to which the M4 standard varies across administrations.
Proportion failing under M4
In , M4 provides a ‘secondary’ standard in the sense that it produces only a small proportion of the failing candidates in this exam (2/11 = 18%). shows a corresponding analysis across all 442 exams in the PLAB2 dataset to calculate the passing/failing profile of candidates under the application of BRM and M4.Footnote1
Table 6. Candidate level pass/fail breakdown across all data.
Across the full data we see that the M4 standard in PLAB2 data is typically secondary in the sense that only around 1 in 4 failing candidates (978/3,838 = 25%) actually fail based on M4 only (see shaded rows of ). The remaining 3 out of 4 failures fail on the BRM hurdle (or both hurdles).
Variation in M4 standard
Our final analysis shows how M4 varies across the PLAB2 data (, for 18 station PLAB2 exams only).
Figure 2. The M4 minimum station standard (18 station PLAB2 exams only, rounded) (n = 372).
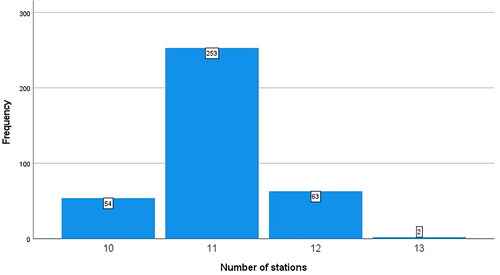
This analysis suggests that the typical (modelled) number of stations that are passed for the hypothetical borderline candidate does indeed vary from exam to exam—from 10 to 13 out of 18 stations, but with the typical (median) standard 11 (in 253 out of 372 = 68% of the exams in the study). Over the period in question, the actual MNSP hurdle as set by the panel overseeing PLAB2 was fixed at 11 out of 18, and so did actually correspond to the M4 standard in over two-thirds of the exams.
Discussion and conclusions
This paper set out to investigate and compare different ways of setting a minimum number of station conjunctive standard in OSCEs—using an examinee-centred and criterion-based approach that conforms to recommended standard setting practices (Cizek and Bunch Citation2007; McKinley and Norcini Citation2014; Streiner et al. Citation2015, p. 145). The paper adds to the evidence base in at least two important ways.
First, the reliability of the total number of stations, something not widely considered in the literature (Ben-David Citation2000; Clauser et al. Citation1996; McKinley and Norcini Citation2014), is shown to be of a similar level to that of the total score in the exam (). Our work, taking account of variation in assessor stringency and station difficulty (), shows this ‘score’ has adequate reliability, and can be used as a defensible summary measure of candidate performance, at least in this context (Streiner et al. Citation2015, chap. 8). In settings where exams take place less frequently than in PLAB2, it should be possible to estimate the reliability of the number of stations passed in an exam more simply using Cronbach’s alpha for a single administration, as is common practice for station scores (Leppink Citation2019; Tavakol and Dennick Citation2011). Whilst somewhat problematic (Sijtsma Citation2009),Footnote2 this will give some indication of how well the number of stations passed ‘works’ as a summary measure of performance across the OSCE. More technical research, possibly using simulation methods, is required to better understand the reliability (and ideally, classification accuracy) of the joint pass/fail decision that uses both the cut-score and minimum station passed standard in combination (Haladyna and Hess Citation1999).
Second, a particular method of defensibly setting such a minimum station standard (M4, ) is identified and evaluated, both from a theoretical perspective, and empirically in comparison to three alternative methods. The M4 approach has a number of important advantages:
It uses all assessment outcomes from the exam (Pell et al. Citation2010).
It does not require any (additional) judgments as to which candidates form the ‘borderline’ group at the exam level ().
It is always calculable, and relatively easy to calculate post hoc (again, ).
It acts as a secondary standard—producing, in PLAB2 data, around an additional third of failures in comparison to the ‘main’ BRM standard ().
The standard produced corresponds, for the majority of examinations, with the fixed a priori standard set by the PLAB2 panel of mostly senior clinicians ().
This combined evidence suggests that in settings where fixed MNSP standards are currently used, pass/fail decisions would likely be more defensible using the M4 approach. Changes to PLAB2 standard setting policy, informed by this study, are currently under discussion.
In other contexts, the M4 standard should be modelled to ensure the findings of the current study largely bear out across different settings, particularly in medical schools where there are often large numbers of candidates across parallel circuits. More work could be done to investigate other properties of M4—for example, the standard error of the cut-score it produces (American Educational Research Association Citation2014, p. 108; Homer et al. Citation2020), and, related, issues around classification accuracy of the joint hurdle (Haakstad Citation2021; Livingston and Lewis Citation1995). Other modelling assumptions (e.g. the fixed estimates for candidate, station and examiner) could perhaps be relaxed or changed to investigate whether this is methodologically possible, and what the impact might be on the study findings. Finally, wider assessment policy issues, and the extent to which assessment practices need to be necessarily pragmatic in particular contexts, are also worthy of greater discussion in the assessment literature (Homer and Russell Citation2020).
Ethics statement
The author is on the PLAB2 panel as a paid psychometric consultant. Permission was given by the UK General Medical Council for the analysis of the anonymized data used in this paper. PLAB2 Candidates consent to their examination data being used for research purposes. For reasons of confidentiality and assessment security, the data used in this study is not openly available to researchers or the public.
Highlights of paper
We investigate four ways of setting minimum-stations-passed hurdles in OSCEs, and show the total number of stations passed has reliability close to the total station score. One method is preferred, and adopting it would likely improve standard setting practices in many institutions.
Disclosure statement
The authors report no conflicts of interest. The author alone is responsible for the content and writing of the article.
Additional information
Funding
Notes on contributors
Matt Homer
Matt Homer, BSc, MSc, PhD, PGCE, is an Associate Professor in the Schools of Education and Medicine at the University of Leeds. Within medical education, he has a research interest in assessment design, standard setting methodologies and psychometrics analysis. He also advises the UK General Medical Council on a range of assessment and pyschometric issues.
Notes
1 These figures do not respond to actual PLAB2 pass/fail rates as the precise implementation of borderline regression has varied over the period in question.
2 Where possible, a more nuanced methodology, such a generalizability theory (Bloch and Norman Citation2012) that accounts for different sources of error, would be preferred for this.
References
- Albert A, Anderson JA. 1984. On the existence of maximum likelihood estimates in logistic regression models. Biometrika. 71(1):1–10.
- American Educational Research Association. 2014. Standards for educational and psychological testing. Washington, D.C: American Educational Research Association.
- Australian Medical Council Limited. 2021. Clinical Examination Specifications [Internet]. https://www.amc.org.au/wp-content/uploads/2021/07/2021-07-06-Clinical-Exam-Spec.V0.5.pdf.
- Bates D, Mächler M, Bolker B, Walker S. 2015. Fitting linear mixed-effects models using lme4. J Stat Softw. 67(1):1–48.
- Ben-David MF. 2000. AMEE Guide No. 18: standard setting in student assessment. Med Teach. 22(2):120–130.
- Bloch R, Norman G. 2012. Generalizability theory for the perplexed: a practical introduction and guide: AMEE Guide No. 68. Med Teach. 34(11):960–992.
- Cizek GJ, Bunch MB. 2007. Standard setting: a guide to establishing and evaluating performance standards on tests, First edition. Thousand Oaks, Calif: SAGE Publications, Inc.
- Clauser BE, Clyman SG, Margolis MJ, Ross LP. 1996. Are fully compensatory models appropriate for setting standards on performance assessments of clinical skills? Acad Med. 71(1 Suppl):S90–S92.
- Fielding A. 2004. Scaling for residual variance components of ordered category responses in generalised linear mixed multilevel models. Qual Quant. 38(4):425–433.
- General Medical Council. 2020a. PLAB (Professional and Linguistic Assessments Board). Professional and Linguistic Assessments Board [Internet]. [accessed 2020 May 7]. https://www.gmc-uk.org/registration-and-licensing/join-the-register/plab.
- General Medical Council. 2020b. What is the PLAB 2 exam? What is the PLAB 2 exam? [Internet]. [accessed 2020 May 7]. https://www.gmc-uk.org/registration-and-licensing/join-the-register/plab/plab-2-guide/what-is-the-plab-2-exam.
- General Medical Council. 2022. Requirements for the MLA clinical and professional skills assessment. London: GMC; [accessed 2023 Mar 30]. https://www.gmc-uk.org/-/media/documents/mla-cpsa-requirements-_pdf-84742729.pdf.
- Haakstad H. 2021. betafunctions: functions for working with two- and four-parameter beta probability distributions. [accessed 2021 Jun 25]. https://CRAN.R-project.org/package=betafunctions.
- Haladyna T, Hess R. 1999. An evaluation of conjunctive and compensatory standard-setting strategies for test decisions. Educ Assess. 6(2):129–153.
- Hays R, Gupta TS, Veitch J. 2008. The practical value of the standard error of measurement in borderline pass/fail decisions. Med Educ. 42(8):810–815.
- Hijazi M, Downing SM. 2008. Objective structured clinical examinations as an assessment method in residency training: practical considerations. Ann Saudi Med. 28(3):192–199.
- Homer M. 2022. Pass/fail decisions and standards: the impact of differential examiner stringency on OSCE outcomes. Adv Health Sci Educ. 27:457–473.
- Homer M, Fuller R, Hallam J, Pell G. 2020. Setting defensible standards in small cohort OSCEs: understanding better when borderline regression can ‘work. Med Teach. 42(3):306–315.
- Homer M, Russell J. 2020. Conjunctive standards in OSCEs: the why and the how of number of stations passed criteria. Med Teach. 0(0):1–14.
- Hox JJ, Moerbeek M, Schoot R v d 2017. Multilevel analysis: techniques and applications, Third Edition. 3rd edition. New York, NY: Routledge.
- Jiang Z. 2018. Using the linear mixed-effect model framework to estimate generalizability variance components in R. Methodology. 14(3):133–142.
- Leppink J. 2019. How we underestimate reliability and overestimate resources needed: revisiting our psychometric practice. Health Prof Educ. 5(2):91–92.
- Livingston SA, Lewis C. 1995. Estimating the consistency and accuracy of classifications based on test scores. J Educ Meas. 32(2):179–197.
- McKinley DW, Norcini JJ. 2014. How to set standards on performance-based examinations: AMEE Guide No. 85. Med Teach. 36(2):97–110.
- Pell G, Fuller R, Homer MS, Roberts T. 2010. How to measure the quality of the OSCE: a review of metrics. Med Teach. 32(10):802–811.
- Sijtsma K. 2009. On the use, the misuse, and the very limited usefulness of Cronbach’s Alpha. Psychometrika. 74(1):107–120.
- Streiner DL, Norman GR, Cairney J. 2015. Health measurement scales, 5th edition. Oxford: Oxford University Press.
- Tavakol M, Dennick R. 2011. Making sense of Cronbach’s alpha. Int J Med Educ. 2:53–55.
- The College of Optometrists. 2022. 7.4 Your OSCE results. [accessed 2022 Sep 26]. https://www.college-optometrists.org/qualifying/scheme-for-registration/final-assessment-(osce)/your-osce-results.
- Wood TJ, Humphrey-Murto SM, Norman GR. 2006. Standard setting in a small scale OSCE: a comparison of the modified borderline-group method and the borderline regression method. Adv Health Sci Educ Theory Pract. 11(2):115–122.
Appendix.
Problems with calculating M3
There were two different problems with this method in 8.6% of stations in the dataset—see the first two data rows (shaded) in for the details.
Table A1. Breakdown of problems occurring with calculating M3 in PLAB2 station level data.